- Network
- A
Monitoring EVPN Fabric and BGP. Part 2
Hello, tekkix! My name is Elena Sakhno, I am a senior network engineer in the network services group of the network technologies department at Ozon.
In this part, we will analyze the solution in detail and take a closer look at each component of the system.
Choosing a solution
When choosing a BGP monitoring solution at Ozon, we relied on the following characteristics:
Storing large amounts of data and quick access to it for analytics.
Processing data from dozens and hundreds of BMP sessions from different devices.
Processing large amounts of data within a single session.
Support for BGP EVPN monitoring.
Fault tolerance.
The ability to migrate to the Ozon Platform (what the Ozon Platform is and why it is important to us will be discussed below).
And here are the solutions that made it to our shortlist.
1. OpenBMP
OpenBMP was the first solution we tested. The main reason we did not choose it was the lack of EVPN support. In addition, it was difficult to refine this solution, as the product is written in C++, in which we have no expertise, and it is not on the list of Ozon's development languages.
OpenBMP supports sending messages to Kafka, which adds flexibility to the solution. All messages can be recorded in topics and then consumed into any storage.
This is a good ready-made solution that can be deployed and tested very quickly. It already includes a ready-made docker-compose, which allows you to deploy all the necessary containers: Grafana with ready-made dashboards, Postgres with created tables, Kafka, ZooKeeper, etc.
2. Pmacctd
The Pmacctd solution turned out to be interesting, which includes a Netstream, Netflow (nfacctd) collector and a built-in BMP message collector. But, unfortunately, like OpenBMP, it lacks EVPN support. When directing BMP traffic and messages with EVPN information, the service recognized, processed, and sent only Peer Up/Down, Initiation messages to Kafka, while messages with information about the prefixes themselves were not processed.
Pmacctd has more functionality, and we use it in another project. With this service, you can collect IPv4 traffic statistics and enrich them with BMP data.
It was impossible to finalize this solution for the same reason: there is no expertise and the development language is not supported. It is worth noting that Pmacctd is actively developing and improving, so after making changes to the Pmacctd code, it would be very difficult to update.
3. Gobmp
The last tested solution was the Open Source project Gobmp. The testing was not entirely successful. We immediately got an AS number overflow error, as we use 4-byte numbers. After reviewing the code written in Go, we quickly found the cause and fixed the AS overflow error. A big plus was that the service parsed EVPN messages without modifications and was written in Go, which is supported in Ozon.
The service has nothing but the BMP message parser itself. It expects incoming TCP sessions, receives BMP messages, parses them into fields, forms JSON from them, and sends the formed messages to the output.
Gobmp allows you to write the final formed messages to a file, output to the console, or send to a Kafka message broker. This suited us more than enough.
In addition, Gobmp already supports many types of NLRI:
IPv4 Unicast, Labeled Unicast
IPv6 Unicast, Labeled Unicast
L3VPN IPv4 unicast
L3VPN IPv6 unicast
Link-state
L2VPN (VPLS)
L2VPN (EVPN)
SR Policy for IPv4
SR Policy for IPv6
Testing was carried out locally: the Gobmp service was launched on a work laptop, containers with Kafka and Kafka-UI, to which the processed data was sent, and Wireshark to check the correctness of parsing all BMP messages. We saw the original message in the traffic dump and the final message in JSON format in Kafka-UI.
During testing, several minor bugs were found and fixed.
The biggest drawback was the lack of an IP address and/or the name of the network device from which the BMP session was built. Instead, there was only information about the IP address of the physical interface from which the BGP session was established and monitored. Thus, to determine from which device we received the BMP data, it was necessary to keep a table of correspondence of all physical interfaces and network device names, which was inconvenient.
It was decided to slightly modify the BMP collector.
And we started developing our own service, which we called bmp-collector, in order to add the features we lacked, as well as to port the code to Ozon platform libraries.
Final solution
General scheme
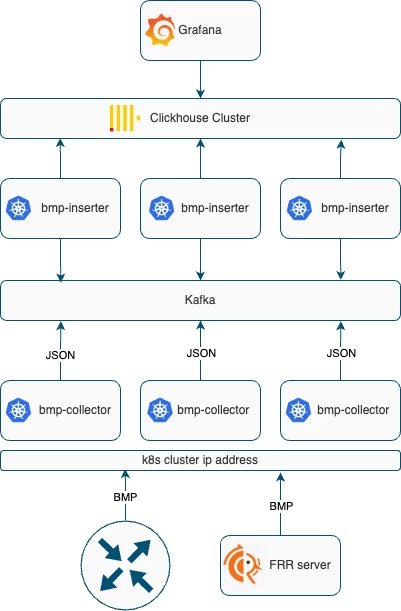
Let's take another look at the solution that was presented in the first part of the article and analyze each element in detail.
What we ended up with
1. Our customized BMP collector, which was named bmp-collector, is deployed in Kubernetes on three pods. Connection to it is made via the common virtual address Kubernetes Cluster IP:
If we monitor those NLRI that are supported by the network device, the BMP session is established from the network device to the BMP collector.
If we want to monitor EVPN, we configure an intermediate FRR server from which we receive all updates via the BMP protocol.
2. The main task of bmp-collector is to receive the packet, parse it into fields, form a message in JSON format and send it to the Kafka broker, which smooths out message spikes.
3. We needed an additional service bmp-inserter, which reads messages from Kafka topics and sends them to Clickhouse. In our case, this service also helps to enrich the data. It is written in Go, but it can be replaced by an additional Clickhouse table with the Kafka engine if you do not have restrictions on its use.
4. The data first goes to the main tables of the Clickhouse database, which store complete information, i.e., the entire history of changes in the state of BGP sessions and prefixes:
The "peer" table — information about all Peer Up/Down events.
The "prefix_v4" table — information on IPv4 prefixes obtained from BMP Route Monitoring messages.
The "evpn" table — history of EVPN prefix changes.
The "statistics" table — information obtained from BMP Stats Report messages.
All this is historical data. After that, through a materialized view, the data is transferred to tables with the current state of BGP neighbors and BGP tables: peer_current, prefix_v4_current, evpn_current.
5. All alerting and graph display in Grafana are carried out through queries in Clickhouse, but in the near future, it is planned to write an API for the service.
BMP collector
As mentioned earlier, we use a customized Open Source product Gobmp as a BMP collector. Let's consider what changes were made and why they were done.
Transition to platform libraries
At Ozon, an entire department (Platform) develops resources necessary to support the entire application lifecycle, including design, development, testing, deployment, and hosting. When creating your service, you do not need to independently deploy a Kafka, Clickhouse, Grafana cluster, a tracing and logging system, you do not need to become their administrators and take care of their fault tolerance and scalability. Everything is already prepared and configured.
But to fully take advantage of the platform, the service must use Ozon's standard platform libraries. By connecting the internal logging library to your service, you get a ready-made solution, all logs become available on the corporate server with a convenient graphical interface.
Using platform libraries, the service immediately receives logging, alerting, collection of basic metrics, ready-made dashboards in Grafana, tracing. All this is very convenient and fast. You do not need to be distracted by this and waste time. Libraries have been written for interacting with platform services, which already implement mechanisms for inter-service authentication, load balancing, and failover. The libraries optimize and simplify interaction with resources.
To take advantage of all the platform's benefits during the service refinement, we decided to migrate the bmp-collector service to platform libraries.
Some service settings were moved to Realtime Config, allowing them to be changed without a restart. Necessary metrics for monitoring the service state and tracking the current load were added, the logging library was replaced, and authorization for accessing Kafka topics was configured.
Changes made
Besides migrating to platform libraries, the most significant improvement was adding information about the network device from which the BMP session to the collector is established.
As previously mentioned, this was the biggest drawback of the collector. The service did not record the IP address or Hostname of the network device from which the BMP session was built. Instead, there was only information about the IP address of the physical interface from which the monitored BGP session was built. Thus, to determine from which device we received BMP data, it was necessary to maintain a table of correspondence of all physical interfaces with Hostname, which was inconvenient.
The first implementation was very simple. All the necessary information was collected from the BMP packet content, and the source IP address of the network device from which this packet came was taken from the IP header of the same packet. Everything worked perfectly on the test stand. But when deploying in Kubernetes, it turned out that the Source IP of all packets is hidden behind NAT when sending data to the common address of all service pods — Cluster IP. We could not refuse to use Cluster IP and send data to specific pod addresses, as this would reduce the fault tolerance of the entire service.
The second approach completely solved this problem. As we remember, the first packet that arrives when establishing a BMP session is Initiation, which contains information about the device: device description and Hostname. And to use this information, we wrote an Initiation message handler.
The following logic was added to the code. If the first packet received after installation is not Initiation, then it is an error, and we terminate the connection. If the first packet is Initiation, then we create a new structure with the fields Hostname and IP address of the BMP client. Then, for the current connection, we use the obtained data to enrich all BMP packets.
In addition to the Initiation packet handler, a Termination packet handler was written.
Data from Initiation and Termination messages are not stored in the database. They are used in the BMP collector logs: in the logs, we see when and which network device connected to the collector and when and for what reason the session was terminated.
Below is an example of a collector log.
Initiation | "timestamp": "2024-10-18T06:55:28.892Z", "message": "bmp initiation message: sysDescr: Routing Platform Software VRP (R) software, Version 87.2 (9006) Copyright (C) 2012-2022 Network Technologies Co. sysName: leaf2.dc1.stg" |
Termination | "timestamp": "2024-10-18T06:55:28.892Z", "message": "bmp termination message: reason: session administratively closed" |
Handlers for some attributes and types of TLV statistics were also added.
A handler for the reason for the termination of the BGP session was written in accordance with the codes listed in RFC 4489, RFC 9384, and RFC 4271, which allowed configuring notifications of different levels of importance.
Below is an example of Peer Up/Down events.
Timestamp | Action | PeerIP | Reason | ErrorText |
2024-02-09 14:56:42.041000 | up | 10.1.1.1 | 0 | |
2024-02-09 14:58:27.903000 | down | 10.1.1.1 | 2 | FSM: TcpConnectionFails |
2024-02-09 14:58:55.135000 | down | 10.1.7.1 | 1 | Case: Administrative Shutdown |
2024-02-09 14:59:52.535000 | down | 10.1.3.1 | 1 | Case: Administrative Reset |
Initially, the collector was tested with Postgres. BGP attributes of prefixes were stored in a separate table, and the hash of the list of all attributes was used as the key. But in the end, the final choice was the Clickhouse database. In Clickhouse, all BGP attributes are stored next to the prefix, and there is no need to refer to other tables for them.
The outgoing data format of the BMP collector was changed for Clickhouse, the hierarchy in JSON was removed, and the hash calculation for the list of attributes was removed. How we chose the database for our service will be discussed further.
We changed the ExtCommunityList format. Instead of a string, we started using a map, which allowed us to refer to individual ExtCommunity by their name when querying the Clickhouse database, rather than analyzing the string each time.
Fixed errors
During the refinement of the service, several minor errors were fixed in the collector.
Fixed the type of the originAS attribute. We use 4-byte numbers, and we were getting overflow and negative values.
Fixed a bug where flags for belonging to Adj-RIB-In pre/post-policy and Adj-RIB-Out pre/post-policy tables were incorrectly set in some cases.
Fixed the Timestamp calculation. Incorrect time was being set.
The network device from which the BMP session is established has been added to the list of fields by which the uniqueness of the prefix is calculated. This is because we encountered errors when the BGP session was established from different devices sending BMP data with the same BGP peer, and all updates from this peer were considered the same.
All these changes allowed us to get the message format we needed, which was convenient to work with further.
Let's see what the messages look like in JSON format right after being processed by the BMP collector.
JSON Message Examples
Below is an example of a Peer Up message. All information from the TCP packet with BMP has been placed in the corresponding fields. In addition, information about the source of BMP messages from the Initiation messages has been added — these are the client_ip and client_sysname fields.
In this message and all others, some fields are filled based on the Per Peer header. Namely:
The timestamp field contains the information update time.
The peer_ip, peer_type, peer_asn, peer_bgp_id, peer_rd fields include information about the BGP neighbor.
Flag information is stored in the is_adj_rib_post_policy, is_adj_rib_out, is_loc_rib_filtered, is_ipv4 fields.
We changed the format of the adv_cap and recv_cap fields to a numeric list, as it was inconvenient for us to store the full description of BGP-capability as a list of strings.
The peer_hash field is calculated by the collector based on peer_ip, peer_asn, peer_bgp_id, peer_rd and is used in the database to determine the uniqueness of the BGP neighbor.
Peer Up Message Example
{
  "action": "add",
  "timestamp": "2024-08-08T13:12:42.022Z",
  "client_ip": "10.1.2.96:30995",
  "client_sysname": "core.dc1",
  "peer_hash": "c3cbd0e5573dddf0d688cc238a4dfc77",
  "peer_ip": "10.1.5.11",
  "peer_type": 1,
  "peer_asn": 42009012,
  "peer_bgp_id": "10.1.5.11",
  "peer_rd": "0:0",
  "peer_port": 36101,
  "local_ip": "10.1.2.1",
  "local_asn": 42009001,
  "local_bgp_id": "10.1.1.4",
  "local_port": 179,
  "is_ipv4": true,
  "adv_cap": [ 1, 2, 64, 65 ],
  "recv_cap": [ 1, 2, 6, 64, 65, 70 ],
  "recv_holddown": 180,
  "adv_holddown": 180,
  "is_adj_rib_post_policy": true,
  "is_adj_rib_out": false,
  "is_loc_rib_filtered": false
}
Next is an example of a Route Monitoring BMP message for an IPv4 prefix. As with Peer Up messages, the fields timestamp, peer_ip, peer_type, peer_asn, peer_bgp_id, peer_rd, is_adj_rib_post_policy, is_adj_rib_out, is_loc_rib_filtered, is_ipv4 are formed based on the Per Peer message header.
All other fields are formed based on the information from the message itself. We see the changed format of the ext_community_list field. As noted above, it was changed for easier access to individual extended communities.
The hash field is used to determine the uniqueness of the prefix and is a hash of the fields peer_hash, prefix_full, is_adj_rib_post_policy, is_adj_rib_out, is_loc_rib_filtered.
Example of a Route Monitoring message — IPv4
{
  "action": "add",
  "timestamp": "2024-08-09T07:36:52.334422Z",
  "client_ip": "10.1.2.122:51311",
  "client_sysname": "bg.dc2",
  "peer_hash": "dde9634904e7dd058a7bb1e047e46335",
  "peer_ip": "0.0.0.0",
  "peer_type": 3,
  "peer_asn": 42009002,
  "peer_bgp_id": "10.1.3.3",
  "peer_rd": "0:0",
  "hash": "6859183c2100fa00f283a183c39d32b7",
  "prefix": "187.165.39.0",
  "prefix_len": 24,
  "prefix_full": "187.165.39.0/24",
  "is_ipv4": true,
  "nexthop": "80.64.102.24",
  "is_nexthop_ipv4": true,
  "origin": "igp",
  "as_path": [ 20764, 8359, 3356, 174, 8151 ],
  "as_path_count": 5,
  "community_list": [ "44386:60000" ],
  "ext_community_list": {
    "ro": [ "507:2" ]
  },
  "origin_as": 8151,
  "is_adj_rib_post_policy": false,
  "is_adj_rib_out": false,
  "is_loc_rib_filtered": true
}
A very similar format is used for Route Monitoring messages for EVPN prefixes. This example better shows how much more convenient it is to use ext_community as a hash table.
Example of a Route Monitoring message — EVPN
{
  "action": "add",
  "timestamp": "2024-10-11T19:24:07.491383Z",
  "client_ip": "10.1.1.11:3545",
  "client_sysname": "evpnfrr03.stg",
  "peer_hash": "de3a42f739d73ea6836afabdf9143bd7",
  "peer_ip": "10.1.0.12",
  "peer_type": 0,
  "peer_asn": 42009011,
  "peer_bgp_id": "10.1.2.21",
  "peer_rd": "0:0",
  "hash": "f968c4f2cb3e255e9ca13feb9e816c24",
  "route_type": 2,
  "is_ipv4": true,
  "nexthop": "10.1.0.94",
  "is_nexthop_ipv4": true,
  "mac": "02:00:00:05:03:01",
  "mac_len": 48,
  "vpn_rd": "10.1.2.5:11000",
  "vpn_rd_type": 0,
  "origin": "incomplete",
  "as_path": [ 42009012, 42009011, 42009010, 42009011 ],
  "as_path_count": 4,
  "ext_community_list": {
      "encap": [ "8" ],
      "macmob": [ "1:0" ],
      "rt": [ "903:5001", "903:11000" ]
  },
  "origin_as": 42009011,
  "labels": [ 0 ],
  "rawlabels": [ 0 ],
  "eth_segment_id": "00:00:00:00:00:00:00:00:00:00",
  "is_adj_rib_post_policy": true,
  "is_adj_rib_out": false,
  "is_loc_rib_filtered": false
}
Let's look at another type of BMP message — Stats Report. The message contains fields already familiar to us from the Per Peer header: timestamp, peer_ip, peer_type, peer_asn, peer_bgp_id, peer_rd, is_adj_rib_post_policy, is_adj_rib_out, is_loc_rib_filtered, is_ipv4. And two fields with data from the first BMP packet Initiation: client_ip and client_sysname.
All other fields are non-zero counters.
Example of Stats Report message
{
  "timestamp": "2024-08-09T07:44:32.840399Z",
  "client_ip": "10.1.2.81:63722",
  "client_sysname": "leaf-d1.dc3",
  "peer_hash": "5720c33ab0232ea4a033698e4bbb135c",
  "peer_ip": "10.0.1.26",
  "peer_type": 0,
  "peer_asn": 42009020,
  "peer_bgp_id": "10.0.3.3",
  "peer_rd": "0:0",
  "duplicate_prefix": 935,
  "duplicate_withdraws": 6,
  "invalidated_due_aspath": 185,
  "adj_rib_in": 411,
  "local_rib": 1,
  "adj_rib_out": 417,
  "rejected_prefix": 1,
  "is_adj_rib_post_policy": true,
  "is_adj_rib_out": true,
  "is_loc_rib_filtered": false
}
Kafka Message Broker
After forming JSON messages, the BMP collector sends them to the Kafka broker, which helps to smooth out large spikes in messages.
What is a Kafka message broker?
The main task of the Kafka broker is fault-tolerant real-time streaming of large amounts of data.
Two terms are often used when mentioning it: producer and consumer.
The operation of the message broker is structured as follows. Producers write new messages to the system, and consumers request them themselves. After reading the message, it is not immediately deleted and can be processed by multiple consumers.
Messages in Kafka are organized and stored in named topics. That is, it can be said that there is a certain kind of grouping of messages within one topic.
In our case, the BMP collector is the producer, it sends messages, and an additional service is used as the consumer, which will be discussed later.
All messages are distributed across 4 topics, as they have very different formats and then go to the database in different tables, depending on the topic:
the bmp_peer topic contains information about changes in the statuses of BGP neighbors;
the bmp_prefix_v4 topic contains information about all ipv4 prefixes;
the bmp_evpn topic contains information about EVPN prefixes;
the bmp_statistics topic stores all Stats Reports.
Database
Database selection
The bmp-collector service, unlike OpenBMP, is only a parser. Its main task is to receive the BMP packet, parse it into fields, and output it: to a file, to the console, or to the Kafka message broker.
With the bmp-collector service, the task of choosing a storage and writing a consumer arose - a service that reads messages from Kafka topics and sends them to the database.
First, the Postgres database was tested, to which a consumer was written that fetched messages from Kafka and added them to the tables.
Attributes and information about BGP neighbors were moved to separate tables, and the tables with IPv4 and EVPN prefixes referred to them. At the same time, there were two tables for IPv4 and EVPN: with the current representation and with historical data.
Each new event for the prefix was appended to the end of the history table, and in the table with the current representation, a search and update of the record or deletion (if a withdraw was received) occurred.
The schema was chosen solely based on the format of the data received from the collector — it seemed that the use of a separate attribute table was already embedded in the collector. The attributes were allocated to a separate JSON level, a hash was calculated for them already in the collector, and most likely, this was the optimal solution for storing data in Postgres.
When sending about 700 thousand prefixes with this configuration, we received a delay of about 15 minutes, and at that time it seemed acceptable, but we wanted to optimize the solution and reduce the delay.
Next, we looked for other solutions. We moved on to testing the collector in conjunction with the columnar database Clickhouse.
The principle of operation of the columnar database was better suited to the concept of monitoring BGP prefixes: we receive a large amount of data with a large number of attributes, and mainly queries of the type "prefix plus some attributes" will be executed. For this type of query, Clickhouse sends only the columns with the requested attributes, not the entire list. This solution is very well suited for storing historical data.
At the same time, the task arose of how to organize the storage of the current representation of BGP tables. If historical tables are the insertion of a large number of records, which works very quickly in Clickhouse, then maintaining a table with the current representation is the constant deletion and updating of records in the table. It works significantly slower, is more resource-intensive, and, in general, Clickhouse does not recommend doing this.
To solve this problem, the Clickhouse ReplacingMergeTree engine was chosen, it is very well described in the official documentation. In short, it removes duplicate records with the same sorting key value, you just need to choose the sorting key so that the prefixes are updated correctly. But this was not a big problem for us. It was necessary to choose the properties of the prefix that made it unique.
And it seems that this is an excellent solution, the DB itself makes the replacement. But there is a downside: the replacement does not happen instantly when a new record appears, but after insertion, after some time in the background, and, as stated in the documentation, the time cannot be predicted:
“Data deduplication is performed only during merges. Merges occur in the background at an unknown time, which you cannot rely on.”
As a result, we still settled on this solution, and closed the update delay by querying the DB with the DISTINCT ON option, which removes duplicates during the query.
We later started using this engine for tables that store the entire history of prefix changes, but added a Timestamp to the sorting field.
Why was this done?
As described in RFC 7854, when a BMP session is established, the network device sends the entire dump of routes that are currently present in all tables added to the monitoring. Thus, breaking and re-establishing the BMP session significantly adds data to the tables, while the Timestamp update time for these routes is the same. For example, if a BMP session monitoring the full view is re-established, all routes will be duplicated in the table, if the session is re-established again, then they will be tripled. And this data will not disappear and will remain for the entire time we keep the history. The ReplacingMergeTree engine allows you to get rid of such duplicates in the background.
The delay in processing 700 thousand routes is currently about 1 minute, and we are more than satisfied with the result. But the search for the most optimal solution continues, and we may choose another database for storing the current BGP representation. However, Clickhouse copes excellently with storing historical data on prefixes.
With the change of the database, the schema also changed: we abandoned storing attributes in a separate table, and now all attributes are stored next to the prefix. The minimally necessary information about BGP neighbors is also in the table with prefixes. This allowed us not to use queries with data joining from multiple tables.
As mentioned above, the BMP collector service allows sending data to Kafka. During the testing of the Postgres database, a consumer was written that transferred data from Kafka topics to Postgres tables.
During the testing of Clickhouse, everything turned out to be much simpler: the consumer was built into Clickhouse. To configure it, it was only necessary to create a table with the Kafka engine and specify from which servers and which topics to read data. It is important to specify all field types correctly, otherwise the consumer will not be able to put the data into the table.
But during the testing and refinement of the BMP collector service, Ozon decided to abandon the use of the Kafka engine in the Clickhouse database. To transport data from Kafka topics to Clickhouse tables, the platform team developed libraries that allowed writing a consumer with minimal effort. A little later, in our solution, the consumer not only performed data transport but also enriched the data with additional information.
Clickhouse
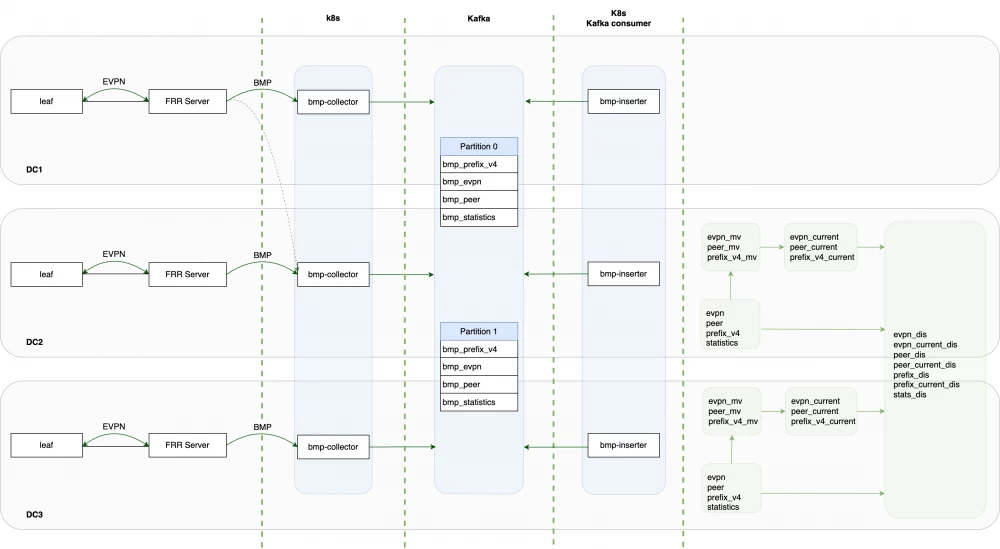
The complete solution and the list of used tables are presented in the diagram below.
The consumer takes data from Kafka topics and sends them to the corresponding tables:
data from the topic with information about BGP neighbors goes to the peer table;
data from the bmp_prefix_v4 topic goes to the prefix_v4 table;
data from the bmp_evpn topic goes to the EVPN table;
data from the bmp_stats topic goes to the statistics table.
The tables listed above store historical data, i.e., all updates sent by the BMP collector, except for duplicates that occur when the BMP session is reinstalled. Such duplicates have all fields identical, including the timestamp (the time the event occurred on the network device).
The engine used for these tables is ReplacingMergeTree, and the columns ClientSysName, Hash, and Timestamp are specified as sorting fields (ORDER BY).
Materialized views in Clickhouse are used to obtain the current state of BGP tables from historical messages. The materialized view is used only to copy data from historical tables to tables with the current view, which also uses the ReplacingMergeTree engine, but only the columns ClientSysName and Hash are specified as sorting fields, which ensures that only the latest updates are stored.
How we get information about MAC mobility, VLAN, and switch
As can be seen from the examples of messages in JSON format above, EVPN messages do not have separate fields with information about MAC Mobility, VLAN, and the address of the switch from which the update came. The bmp-inserter service is used to enrich messages with this information, which transports information from Kafka topics to Clickhouse.
The MAC Mobility and MAC Mobility Type fields are populated based on information obtained from the Extended Community MAC Mobility "macmob": [ "1:0" ], where 1 indicates that the address is static and cannot move, and for type 0 movement is possible, and it is better to monitor the sharp increase in this counter.
Getting the switch address and VLAN in our case is very simple. This information is contained in the vpn:rd field. Vpn:rd is assigned according to the principle
If it is not possible to directly obtain this information from vpn:rd, you can always connect a dictionary in Clickhouse with this information.
Grafana
After we have saved all the data in Clickhouse tables, we need to display them. Grafana is used in Ozon for displaying, creating dashboards, panels, and graphs.
Grafana is a very flexible tool that allows you to create panels and dashboards based on data from various sources. Clickhouse is connected as a data source, and all panels in Grafana are queries with parameters to the database.
Setting up BMP Monitoring
Monitoring BMP IPv4 Sessions
Setting up IPv4 BMP monitoring on network devices varies for different vendors, but usually for the BMP protocol to work, it is necessary to:
Set up a session to the BMP collector, in the settings of which the address, port of the collector, and the interface of the network device from which the BMP session will be established are usually specified.
Specify BGP neighbors or individual VRFs for which monitoring will be enabled, and list the tables for which BMP data will be sent.
To receive statistical reports, it is necessary to specify the frequency of their sending.
Monitoring BMP EVPN
As mentioned above, many network equipment manufacturers do not currently support BMP EVPN monitoring. To receive all EVPN routes, we are still using an intermediate FRR server, which establishes an EVPN session with one of the data center switches and sends all received updates via BMP. This scheme imposes its limitations: we only see the routes that the neighboring FRR leaf considered the best, but even in this configuration, BMP EVPN monitoring opens up great opportunities.
Setting up the FRR Server
The FRR service is an Open Source solution and represents a software router. We have tested and are currently using version 9.0.1.
Installing FRR is simple, detailed in the official documentation, ready-made Debian and Redhat packages are available.
Before starting the FRR service, it is necessary to enable bgp and bmp support in the /etc/frr/daemons configuration file, for this you need to change the following settings:
bgpd=yes
bgpd_options=" -A 127.0.0.1 -M bmp"
After preparing the configuration file, you can start the service with the command "systemctl start frr" and then configure the service through the vtysh interface, which is very similar to the usual CLI. To enter the vtysh interface, after starting the FRR service, you need to type the command "vtysh".
The "wr mem" command is used to save the settings. Below is an example configuration.
FRR Configuration
frr defaults traditional
hostname evpnfrr
log syslog informational
no ip forwarding
no ipv6 forwarding
service integrated-vtysh-config
!
ip route 10.1.100.0/23 Null0
!
router bgp 42009014
 no bgp ebgp-requires-policy
 no bgp default ipv4-unicast
 neighbor 10.1.0.15 remote-as 42009015
 bgp allow-martian-nexthop
 !
 address-family l2vpn evpn
  neighbor 10.1.0.15 activate
  neighbor 10.1.0.15 allowas-in 1
  neighbor 10.1.0.15 route-map block out
 exit-address-family
 !
 bmp targets BMP_PROD
  bmp monitor l2vpn evpn post-policy
  bmp connect 10.1.1.2 port 5000
 exit
 !
 bmp targets BMP_STG
  bmp monitor l2vpn evpn post-policy
  bmp connect 10.1.1.4 port 5000
 exit
exit
!
route-map block deny 10
It is important to note that FRR does not send BMP protocol information for EVPN routes if it does not have a route to the Nexthop.
To bypass this limitation, a static route to the Null interface is used to the network that includes the addresses of all possible Nexthops.
FRR Configuration Check
After configuring FRR, it is necessary to check the status of BGP and BMP sessions. To do this, you can use the following commands:
show bgp l2vpn evpn summary
BGP router identifier 10.1.0.16, local AS number 42009014 vrf-id 0
BGP table version 0
RIB entries 22437, using 2103 KiB of memory
Peers 1, using 20 KiB of memory

Neighbor        V         AS   MsgRcvd   MsgSent   TblVer  InQ OutQ  Up/Down State/PfxRcd   PfxSnt Desc
10.1.0.15     4 42009015     83106      2602     9906    0    0 1d19h20m        45124        0 N/A

Total number of neighbors 1
show bmp
BMP state for BGP VRF default:

  Route Mirroring         0 bytes (0 messages) pending
                          0 bytes maximum buffer used

  Targets "BMP_PROD":
    Route Mirroring disabled
    Route Monitoring l2vpn evpn post-policy
    Listeners:

    Outbound connections:
 remote              state                       timer      local
 ----------------------------------------------------------------------
 10.1.1.2:5000   Up      10.1.1.2:5000   1d15h20m   (unspec)

    1 connected clients:
 remote              uptime     MonSent   MirrSent   MirrLost   ByteSent   ByteQ   ByteQKernel
 ------------------------------------------------------------------------------------------------
 10.1.1.2:5000   1d15h20m   104529    0          0          19504688   0       0

  Targets "BMP_STG":
    Route Mirroring disabled
    Route Monitoring l2vpn evpn post-policy
    Listeners:

    Outbound connections:
 remote               state                        timer      local
 ------------------------------------------------------------------------
 10.1.1.4:5000   Up      10.1.1.4:5000   1d19h18m   (unspec)

    1 connected clients:
 remote               uptime     MonSent   MirrSent   MirrLost   ByteSent   ByteQ   ByteQKernel
 -------------------------------------------------------------------------------------------------
 10.1.1.4:5000   1d19h18m   113576    0          0          21239802   0       0
Clickhouse Tables
We have described above how the choice of database and table engine was made. In the final solution, we use the following tables and engines.
Table | Sorting Fields | Description |
evpn | ClientSysName Hash Timestamp | Storage of the full history of EVPN prefixes |
evpn_current | ClientSysName Hash | Current EVPN tables |
peer | ClientSysName PeerHash Timestamp | History of BGP session changes |
peer_current | ClientSysName PeerHash | Current state of BGP sessions |
prefix_v4 | ClientSysName Hash Timestamp | History of IPv4 prefix changes |
prefix_v4_current | ClientSysName Hash | Current IPv4 tables |
statistics | Timestamp | Statistical information |
All tables except statistics use the ReplicatedReplacingMergeTree engine. The statistics table remains on the ReplicatedMergeTree engine because Stats Reports messages are not resent under any circumstances.
In addition to the listed tables, the following service tables are used:
Distributed tables combine data distributed across different servers in the Clickhouse cluster.
Materialized view is used to implement a materialized view from the historical table to the tables with current data.
Sorting fields use hashes calculated by the BMP collector itself. The hash helps quickly identify identical prefixes and identical BGP neighbors.
The hash for a BGP neighbor is calculated using the fields: Peer Distinguisher, Peer Address, Peer AS, Peer BGP ID.
The hash for an IPv4 prefix is calculated using the fields: Peer Hash, prefix, mask length, table from which the information was obtained (Adj-RIB-In/Out Pre/Post policy).
For EVPN, the fields used are: Peer Hash, route type, prefix, mask length, gateway address, MAC address, VPN RD type and value, as well as the table membership from which the information was obtained (Adj-RIB-In/Out Pre/Post policy).
Here are all the fields we get when parsing a particular type of BMP message
Route Monitoring IPv4 | Route Monitoring EVPN | Peer Up/Down | Stats Report |
Timestamp Action ClientIP ClientSysName PeerHash PeerIP PeerType PeerASN PeerBGPID PeerRD Hash Prefix PrefixLen PrefixFull IsIPv4 Nexthop IsNexthopIPv4 Origin ASPath ASPathCount MED LocalPref IsAtomicAgg Aggregator CommunityList OriginatorID ClusterList OriginatorID AS4Path AS4PathCount AS4Aggregator TunnelEncapAttr LgCommunityList OriginAS PathID Labels PrefixSID RIB IsAdjRIBPost IsAdjRIBOut | Timestamp Action ClientIP ClientSysName PeerHash PeerIP PeerType PeerASN PeerBGPID PeerRD Hash RouteType Prefix PrefixLen PrefixFull IsIPv4 Nexthop IsNexthopIPv4 GWAddress MAC MACLen VPNRD VPNRDVlan* VPNRDIP* VPNRDType Origin ASPath ASPathCount MED LocalPref IsAtomicAgg Aggregator CommunityList OriginatorID ClusterList ExtCommunityList MacMobility* MacMobilityType* AS4Path AS4PathCount AS4Aggregator TunnelEncapAttr LgCommunityList OriginAS PathID Labels RawLabels ESI EthTag IsAdjRIBPost IsAdjRIBOut IsLocRIBFiltered | Timestamp Action ClientIP ClientSysName PeerHash PeerIP PeerType PeerASN PeerBGPID PeerRD PeerPort LocalIP LocalASN LocalBGPID LocalPort Name IsIPv4 TableName AdvCapabilities RcvCapabilities RcvHolddown AdvHolddown Reason ErrorText IsAdjRIBPost IsAdjRIBOut IsLocRIBFiltered | Timestamp ClientIP ClientSysName PeerHash PeerIP PeerType PeerASN PeerBGPID PeerRD DuplicatePrefixes DuplicateWithdraws InvalidatedDueCluster InvalidatedDueAspath InvalidatedDueOriginatorID InvalidatedDueNexthop InvalidatedAsConfed AdjRIBsIn LocalRib AdjRIBsOutPostPolicy RejectedPrefixes UpdatesAsWithdraw PrefixesAsWithdraw IsAdjRIBPost IsAdjRIBOut IsLocRIBFiltered |
* Fields added through enrichment.
Grafana Setup
Grafana is used to display graphs, charts, and tables based on data received via the BMP protocol. Let's go through the setup of one panel as an example.
The graph shows the number of announced and withdrawn routes over 30 seconds for each VLAN.
The Grafana panel setup consists of two database queries for the time period selected in the dashboard settings. One query is for how many routes were added:
SELECT
  $__timeInterval(Timestamp) as time,
  VPNRDVlan,
  count(MAC) AS mac
FROM evpn_dis
PREWHERE
  $__timeFilter(Timestamp) AND   ( Timestamp  >= $__fromTime AND Timestamp <= $__toTime ) AND
  Action = 'add' AND
  PrefixFull = ''
GROUP BY VPNRDVlan, time
ORDER BY time ASC
The second query is for how many routes were withdrawn. Multiplying the result by -1 makes the graph more visual and displays the withdrawn routes below the timeline.
SELECT
  $__timeInterval(Timestamp) as time,
  VPNRDVlan,
  count(MAC)*(-1) AS mac
FROM evpn_dis
PREWHERE
  $__timeFilter(Timestamp) AND   ( Timestamp  >= $__fromTime AND Timestamp <= $__toTime ) AND
  Action = 'del' AND
  PrefixFull = ''
GROUP BY VPNRDVlan, time
ORDER BY time ASC
All panels in Grafana are created in a similar way: a query is made to Clickhouse, parameters are added if data filtering is needed, and the type of representation (graph, table, chart) is selected.
Below are dashboard ideas for displaying information received via the BMP protocol for EVPN and IPv4.
EVPN Dashboard Examples
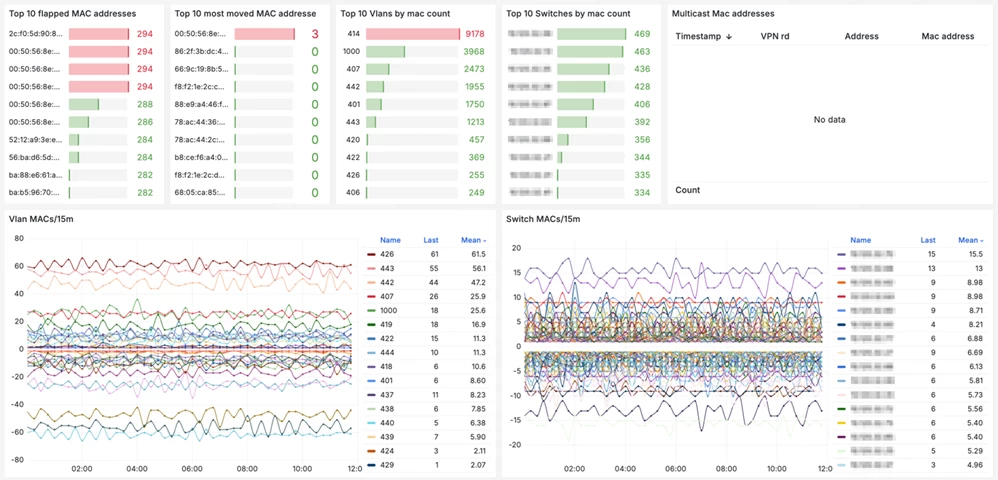
The dashboard can use filters by data center, switch, VLAN, and time filters. The panels below display information about the most unstable MAC addresses, their total number, and their changes.
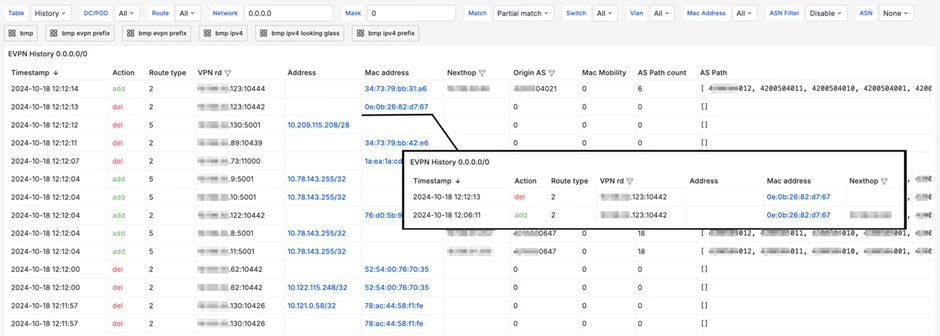
The next dashboard presents a summary table with complete information about route changes. You can select any IP or MAC address and open detailed information about it. The most frequently used filters are configured.
You can view information on current routes or historical data. The filter is located in the upper left corner.
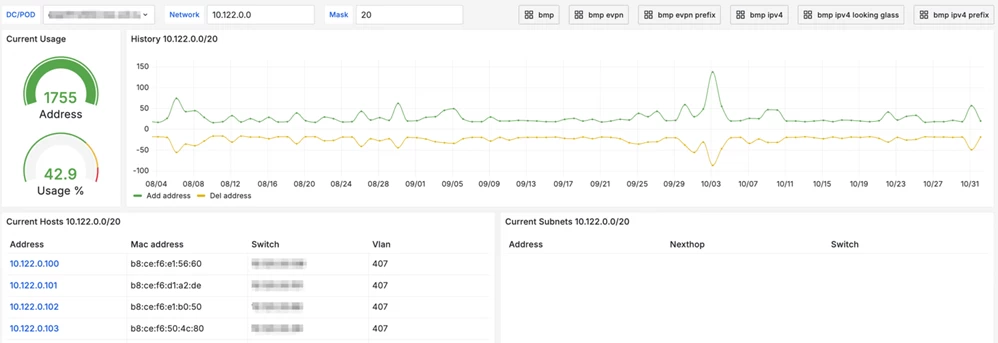
The following dashboard clearly demonstrates how BMP can be used to assess address space utilization.
Examples of IPv4 Dashboards
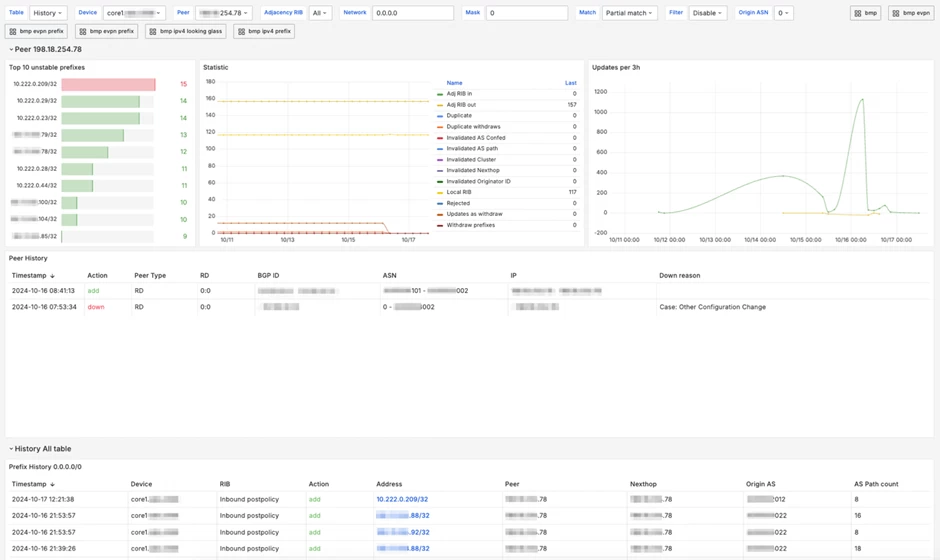
Below is a general dashboard for IPv4, from which you can navigate to any address of interest and view its change history.
Below is a table with detailed information, which we navigate to when selecting the first subnet from the previous dashboard.
The above dashboard helps to evaluate how BGP policies have worked; for this, you just need to select the network of interest.
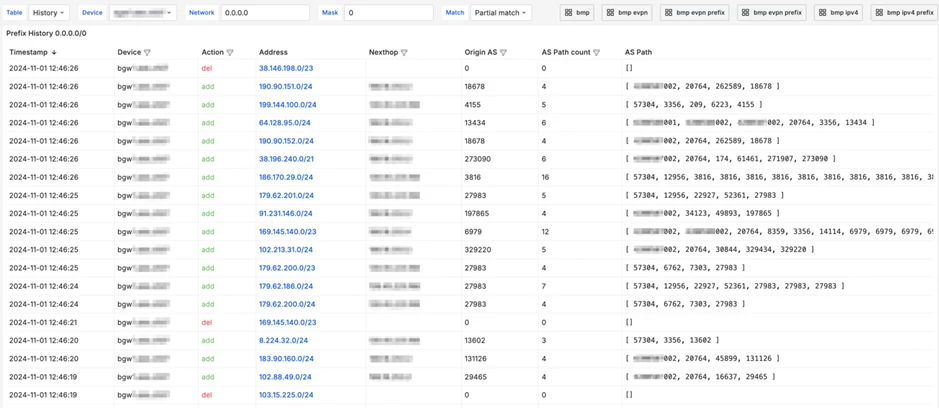
And a summary table, similar to Looking Glass, with detailed information on all prefixes. Here you can choose historical data or the current view.
Fault Tolerance
Initially, the BMP protocol did not include fault tolerance. There is a small section 3.2 Connection Establishment and Termination in RFC 7854 that states that fault tolerance can be implemented by the vendor. The standard itself only provides for a BMP session termination message with the reason "Reason = 3: Redundant connection".
Unfortunately, our devices do not support fault-tolerant BMP connections. In addition, a bug was found on one of the devices. When configuring two BMP sessions, if one session goes Down, the full list of all routes starts to be sent to the active BMP session with the periodicity of sending statistics, which is 30 seconds for us. Given that monitoring was configured for two tables containing full-view, about 2 million messages started coming to the service every 30 seconds.
Despite such a large load and a huge number of messages, the service worked normally, with a delay, but all messages were eventually processed.
Fault tolerance of BMP in Ozon is implemented by placing the service in Kubernetes and announcing a common IP address for all service pods. Currently, the BMP service in Kubernetes uses three pods, to which sessions from network devices are distributed. In case of problems on one of the pods, the sessions are redistributed to the remaining available pods. For the service, it does not matter which Kubernetes pod is used, since in the end, after processing, all messages go to common topics and then to distributed Clickhouse database tables.
Conclusion
The article turned out to be voluminous, so it had to be divided into two parts. Thank you to everyone who read to the end.
From the beginning of the research to the moment the service was put into production, it took about 8 months. At the initial stage, a lot of time and resources were spent on collecting all the missing information, conducting research, testing existing solutions, and checking the operation of the collector in conjunction with Postgres.
When starting the project, we did not have much experience with Clickhouse, Kafka, and Go development, but this was not a big problem. On the contrary, the project helped us to master new tools in practice, and now we actively use them in other tasks.
The article was written to bring together all the information, share experiences, and interest readers in the new protocol. I hope we succeeded, and many have thought about starting to use the BMP protocol in their network. Have you already tested BMP, or maybe you have been using it for a long time?








Write comment