
- AI
- A
How we taught AI to select furniture based on architectural drawings
In the world of construction and interior design, the work of selecting furniture from a catalog using blueprints is still done manually: specialists spend hours flipping through catalogs, checking dimensions and specifications. This routine takes dozens of man-hours for each project.
You have before you a PDF document with 30 pages containing dozens of architectural drawings (elevation). Each one features a kitchen, bathroom, or office with rows of cabinets. Your task is to identify each cabinet in the drawing, understand its type, count the number of doors and shelves, measure dimensions, and based on this data, find the most suitable items in a furniture catalog that contains hundreds of articles.
In the world of construction and interior design, this work is still done manually: specialists spend hours flipping through catalogs, checking sizes and specifications. Construction companies, design studios, and finishing contractors all face the same routine, which takes dozens of man-hours for each project.
We decided to automate this process and built a system that takes as input a PDF with architectural drawings and a furniture catalog, and outputs a list of recommendations with 87% accuracy.
In this article, we will explain how we went from naive faith in all-powerful vLLMs to a well-thought-out pipeline that combines YOLO detection, computer vision clustering, Gemini for feature extraction, and transformers for semantic search through the catalog.
Naive approach: feed everything into LLM
The first thought was simple and, as it turned out later, naive. Why write a complex system if you can send the drawing image along with the PDF catalog directly to a multimodal model? We take the best vLLM, give it everything in context, and get the result.
We started with Gemini 2.5 Pro, which at the time of testing showed the best results in visual tasks. We sent a photo of the plan and a trimmed catalog of 15 pages, each with 10-16 cabinets. For simple types of furniture, the model coped well and could find and recommend the necessary cabinet.
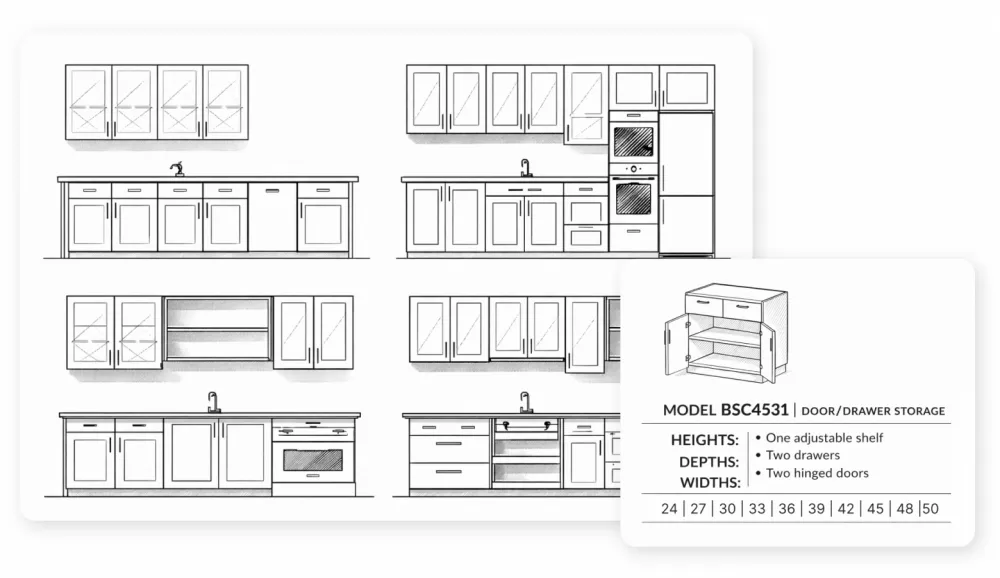
Problems began when scaling up. When the catalog grew from 15 to 120 pages (around 1500 cabinets), the model started to struggle with the volume of information. Additionally, fundamental inconsistencies were discovered:
Mismatch of modalities: the catalog is presented in 3D renders, while the drawings are in 2D format. Visually, these are completely different representations of the same object, and the model does not always find a match between them.
Specificity of cabinet types: each type (pull-out, wall-mounted, sink, shelf) has its own special characteristics and selection rules. It is impossible to convey all the nuances in one prompt, and the model cannot retain these rules in context.
Counting errors: the model systematically made mistakes in counting the number of cabinets on the plan and hallucinated dimensions, which are critically important parameters for selection.
The next step was to find a better model, and we tested three leading models on a sample of 20 plans with a complete catalog (120 pages):
Model | Accuracy | Strengths | Weaknesses |
Gemini 2.5 Pro | 34% | Better than others in image analysis | Makes mistakes in counting, hallucinates sizes |
GPT-5 | 8% | More accurate in counting the number of cabinets | Cannot match based on the catalog, responds randomly |
Grok 4 (xAI) | 17% | Average between Gemini and GPT | Inferior to Gemini in depth of analysis |
The results were disappointing: none of the models managed to even come close to acceptable quality. It became clear that the task was too multifaceted for a single end-to-end solution based on vLLM.
However, before abandoning the "naive" approach, we tried to structure the catalog through RAG (Retrieval-Augmented Generation). The idea was to encode the catalog in such a way that the model could navigate it better.
We tested several indexing strategies for the PD catalog, including chunking by pages and semantic segmentation. RAG slightly improved the search quality in the catalog (up to ~40% with Gemini), but fundamental problems remained unresolved: counting the number of cabinets, hallucinations of sizes, and confusion in furniture types.
These errors were on the side of visual analysis. As a result, we made the decision to break the task down into specialized subtasks and use the most appropriate tool for each. This became a turning point for the project.
Subtasks and Final Architecture of the Solution
By analyzing the errors and strengths of each approach, we decomposed the task into five sequential stages, each solved with the most suitable tool:
Stage 1. Detection of cabinets in the drawing
Stage 2. Clustering of cabinets
Stage 3. Extraction of dimensions
Stage 4. Description of cabinet features
Stage 5. Semantic search and ranking in the catalog
Stage 1. Detection of Cabinets
The first and most important stage is to accurately detect each cabinet in the drawing. If an error occurs here, it cascades down to all subsequent steps. And that is very bad.
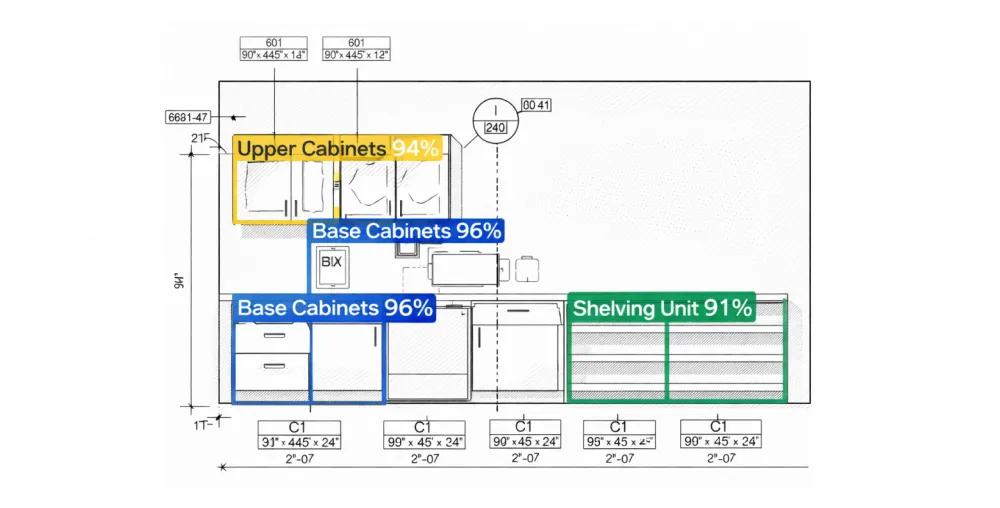
For training, we annotated over 5000 original plans, highlighting specific classes of cabinets, which will allow us to separately recommend items from the catalog in the future. The final accuracy of the detector on the test dataset was 96% ([email protected]). This is a fairly high result for architectural drawings, considering the variety of styles.
The most non-trivial problem of detection is nested cabinets. In the drawings, some cabinets are visually nested within others.
For example, a tall single-door wardrobe can consist of a hanging cabinet on top and a bottom part, while a double-door wardrobe is two single-door wardrobes side by side. It is important for the model to understand this as a single large wardrobe, not several components.
We solved this problem by introducing rules for the hierarchy of detectable bboxes. The algorithm analyzes the overlap of detections, builds a parent-child hierarchy, and excludes duplicates. For example, if a single-door wardrobe is completely contained within a double-door wardrobe of the same class, the system understands that this is an aggregation of single-door wardrobes.
Stage 2. Clustering wardrobes: two modes
After detection, it is necessary to group visually identical wardrobes. This is an important step, and here's why:
First, it allows for an accurate count of the number of identical wardrobes.
Second, if two wardrobes are visually identical, it is sufficient to describe one and assign a common selection result – this reduces the amount of work.
We implemented two approaches, the choice between which depends on the class of detection:
The algorithm computes key points for each wardrobe, builds a pairwise distance matrix based on which it conducts class groupings. This approach works well for wardrobes with distinct textural features, such as handles and door patterns.
The algorithm normalizes the wardrobe and calculates pairwise similarity distance. This algorithm excels at handling the geometric patterns of wardrobes.
Stage 3. Dimension extraction
The dimensions of wardrobes are one of the key parameters for catalog selection. However, in drawings, dimensions are indicated in various ways: extension lines, dimension codes (for example, ZW 34|24|36, where the numbers encode Height|Depth|Width), and sometimes separate annotations.
We considered the option of detecting dimensional inscriptions and linking them to the nearest cabinet. However, the styles of the drawings are too diverse: somewhere there are extension lines with arrows, somewhere there is encoding, and somewhere dimensions are written directly under the cabinet. Developing a universal detector for all styles would be comparably complex to the entire rest of the pipeline.
Vlad Kalinin, developer
Therefore, instead, we use vLLM: we send a crop of the cabinet along with the full image of the plan, and the model should find this cabinet on the plan and determine its dimensions.
In extensive testing of 100 plans: Gemini 2.5 Pro provided an accuracy of 81%, and with the release of Gemini 3, accuracy increased to 87%. This leap became an important boost for the entire system.
Stage 4. Description of cabinet features and preparation of the catalog
4.1 Description of features
This stage is the heart of the system. The quality of selection depends on how accurately each cabinet is described. We create a structured JSON for each cabinet with a clearly defined set of features specific to its class.
Each class of cabinets has its own prompt that takes into account the features that are relevant for this type. For example, for a wall-mounted cabinet, the presence of glazing is checked, while for a sink, this feature is ignored. The prompt contains detailed instructions for visually analyzing the drawing: how to distinguish a door from a shelf, etc.
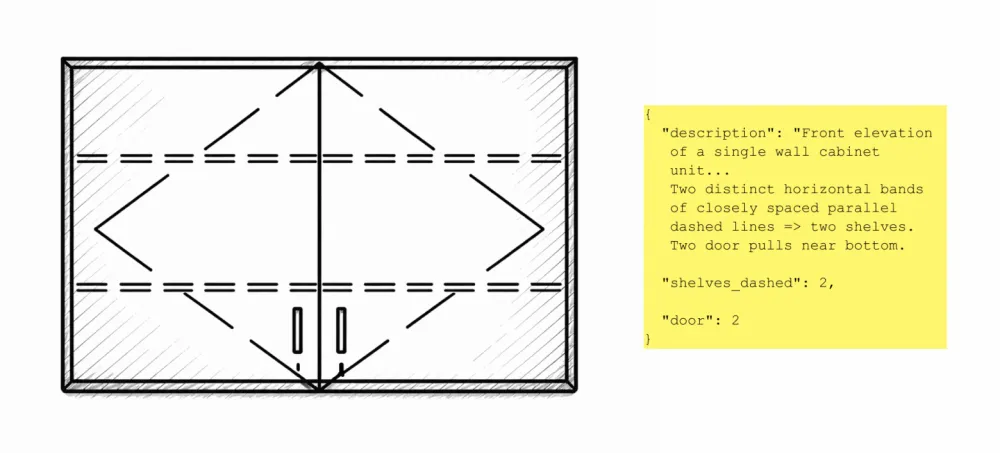
We compared three models for the task of feature description:
Model | Recommendation Accuracy | Typical Errors |
GPT-5 | 62% | Errors in counting doors and shelves, brief descriptions |
Gemini 2.5 Pro | 75% | Quality descriptions, but errors in glazing and shelves |
Gemini 3 | 88% | Minimal errors, accurate counting of features |
The switch to Gemini 3 provided the most significant improvement in the quality of detection for the entire system. The model makes precise descriptions, does not make mistakes in counting features, and generates sufficiently detailed descriptions for subsequent semantic searches.
4.2 Preparation of the Catalog
Alongside processing the drawings, we prepared a furniture catalog in a machine-readable format. Each item in the catalog is described in JSON with the same set of characteristics as the cabinets in the drawings.
To describe the 3D renders of the catalog, we used GPT-5, which generates a complete textual description of each item and highlights its features. The catalog is stored as a set of JSON files, each describing one item.
We chose textual features because during testing for visual similarity, many cabinets are similar and differ only in the number of shelves, glazing, and so on, and no embedding model can accurately distinguish between 2 cabinets based on embeddings. In textual format, we can specify all the characteristics of each cabinet.
Stage 5. Recommendation System
The recommendation block is the final and most complex stage of the pipeline. For each cabinet, the system finds the top 3 most suitable items from the catalog.
The process consists of three phases:
Filtering. For each class of cabinets, a set of constraints specific to that type is determined; for example, for wall cabinets, this includes the number of pull-out drawers. Filtering is implemented through three passes with gradually relaxed constraints. This allowed us to accurately find an alternative in the catalog, even if there was no perfectly matching cabinet.
Size Check. Candidates that passed filtering are checked for size matches. If no candidate meets the size requirements, a retry is performed without size filtering.
Ranking. The remaining candidates are ranked by a composite score:
Results
The overall accuracy of the entire system on the extended test set:
Metric | Value |
Cabinet detection | 96% |
Dimension extraction | 87% |
Feature description | 88% |
Recommendation accuracy | 87% |
Compared to the initial approach, where everything was done in LLM (a maximum of 34% with Gemini 2.5 Pro), the final system provides 87% accuracy – an increase of more than 2.5 times. Additionally, the system processes the document in 5-7 minutes, which is significantly faster than manual work.
Conclusion
LLM is not all-powerful yet. Despite impressive company demos, multimodal models still struggle with complex tasks that require simultaneous object counting, size reading, classification, and searching through a large catalog. Breaking down into specialized stages has resulted in a significant quality increase.
Specific rules are critically important. Without specific filters and nesting rules, universal matching would perform significantly worse. Knowledge of the subject area cannot be replaced by neural networks alone.
Gemini 3 is a notable breakthrough for visual tasks. The transition from Gemini 2.5 Pro to Gemini 3 resulted in a 6-13% increase at different stages. The quality of visual analysis of architectural drawings has improved significantly.






Write comment