- DIY
- A
Experiments with accelerometer and gyroscope on the S7V30 platform
The S7 V30 module was originally designed for controlling industrial controllers but can also be used autonomously. In this article, I will try to reveal its potential as a sensor for detecting and analyzing vibrations, angle deviations, abnormal states, and specific activities. MATLAB and ChatGPT will help me with this.
The S7V30 module was originally designed for controlling industrial controllers but can also be used autonomously. In this article, I will try to reveal its potential as a sensor for detecting and analyzing vibrations, tilt angles, abnormal states, and specific activities. MATLAB and ChatGPT will help me with this.
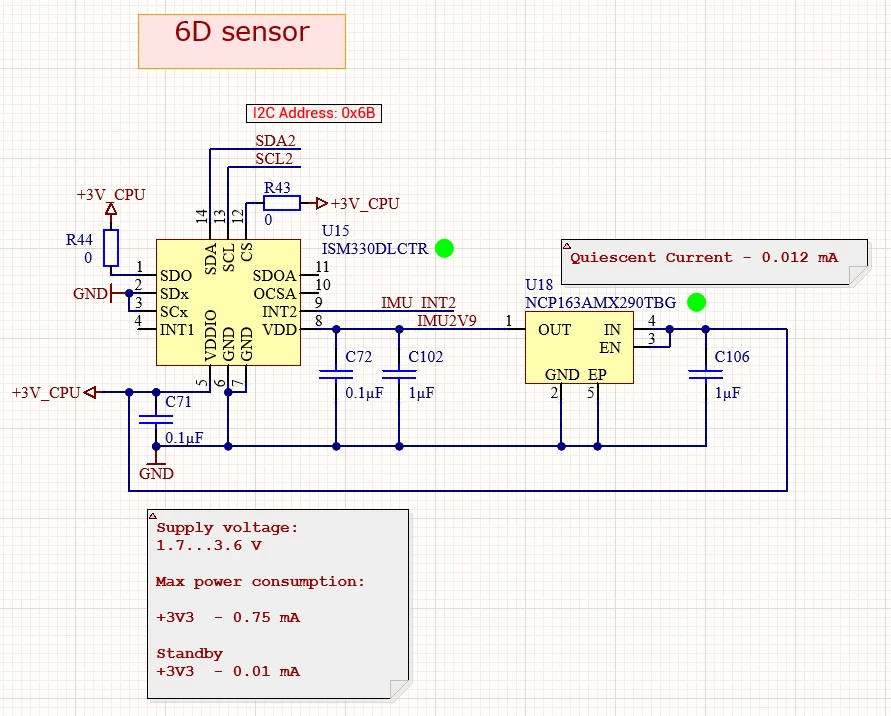
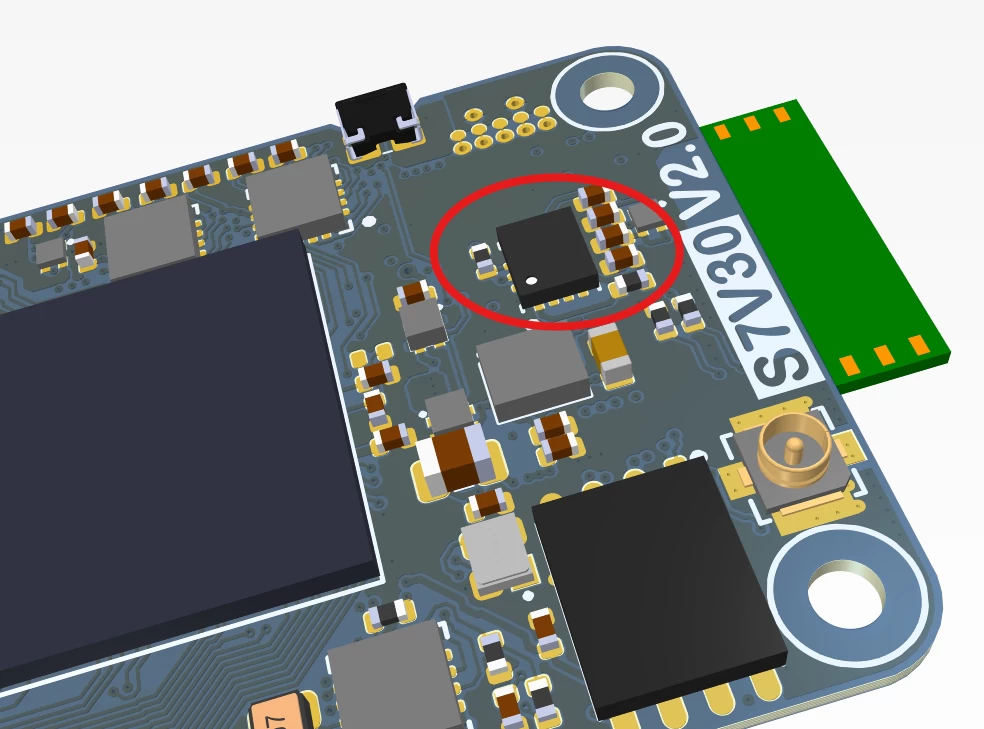
The ISM330DLC chip from STMicroelectronics – iNEMO 6-axis IMU, which combines a three-axis accelerometer and gyroscope, providing digital data output for industrial applications, is installed on the module board.
Connection and placement
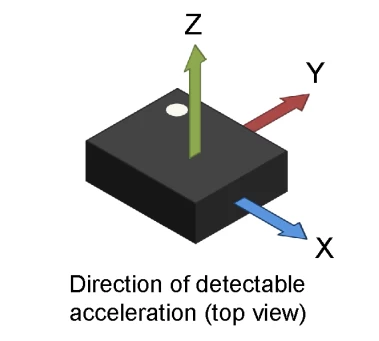
When working with such chips, it is important to know its orientation on the board, as this affects the accuracy of determining rotations and motion vectors.
The chip is connected via the I2C bus with a frequency of up to 400 kHz, and the charger chip and charge level meter operate on the same bus. This imposes limitations on the bus bandwidth: for example, the maximum sampling rate for the three axes of the gyroscope and accelerometer is 1666 Hz – otherwise, the bus simply cannot handle the data flow.
Data acquisition and analysis
For analysis, it is most convenient to send data from the accelerometer to the PC in real-time. The module supports data collection both online and offline – they can be stored on an internal SD card. Data transfer to the computer is carried out via high-speed USB or Wi-Fi, using TCP/IP, FTP, and FreeMaster protocols. We download the recording files via FTP, view live graphs and module telemetry through the FreeMaster environment, and use TCP connection directly in MATLAB for in-depth analysis.
When developing neural network algorithms, significant acceleration of work is provided by automatic data annotation. It can be organized using additional sensors located directly on the observation objects in hard-to-reach places, which is especially convenient due to the compactness and autonomy of the module. Moreover, the modules can be synchronized for joint work in a group.
Chip registers and capabilities
The ISM330DLC chip contains 93 available 8-bit registers. This number is due to the fact that the chip can independently recognize certain types of events, such as free fall, tilt, single and double clicks, and others. However, in this article, we will not explore these functions, as they are related to tasks of minimizing power consumption, and our goal is to accurately measure the physical impacts on the chip and its orientation.
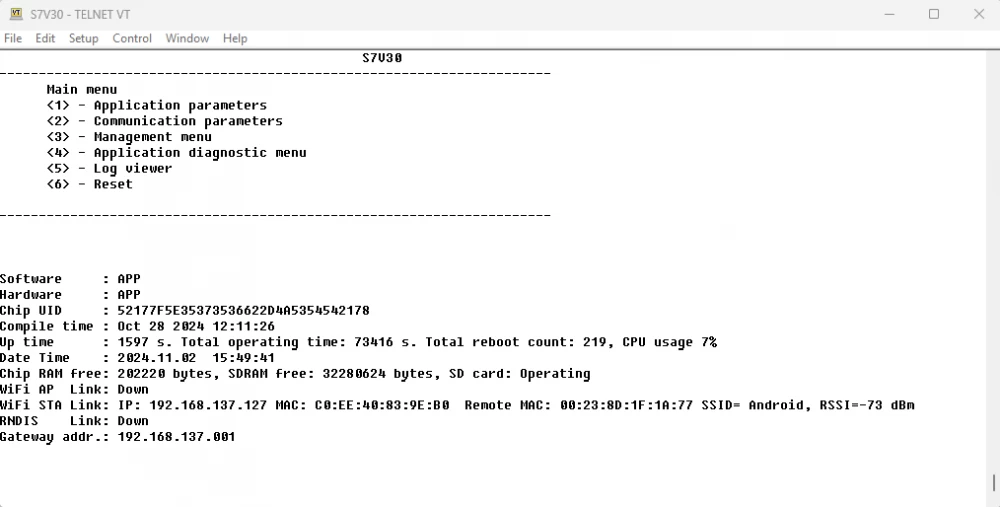
In the current project, a terminal window has been implemented that allows you to observe and change the values of all available registers of the ISM330DLC. You can connect to the terminal through a Telnet protocol client. For example, TeraTerm at the URL telnet://S7V30
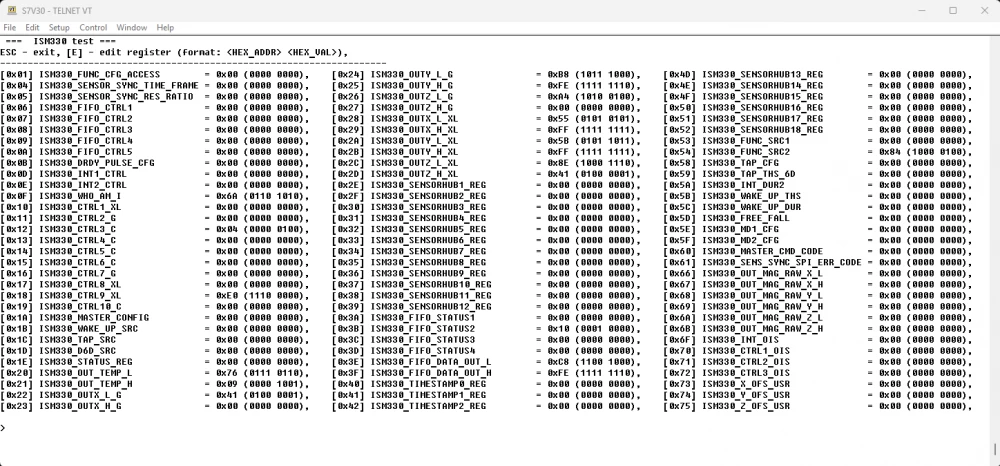
By pressing the button sequence 7 -> 8 -> 4, a window with access to the registers will be opened:
Here on the screen, the register data is displayed in real-time and there is the possibility to write any arbitrary data to any register.
In our project, the chip initialization procedure has already been implemented in accordance with user settings. User settings are stored in the module's non-volatile memory and are also available via the Telnet interface
Initial stage: calibration
The first step is to determine the noise characteristics and sensor drift. This is critically important for the accuracy of subsequent measurements and data analysis.
The main thing to know is that the readings of MEMS accelerometers and gyroscopes are subject to significant noise and error accumulation (drift) over time.
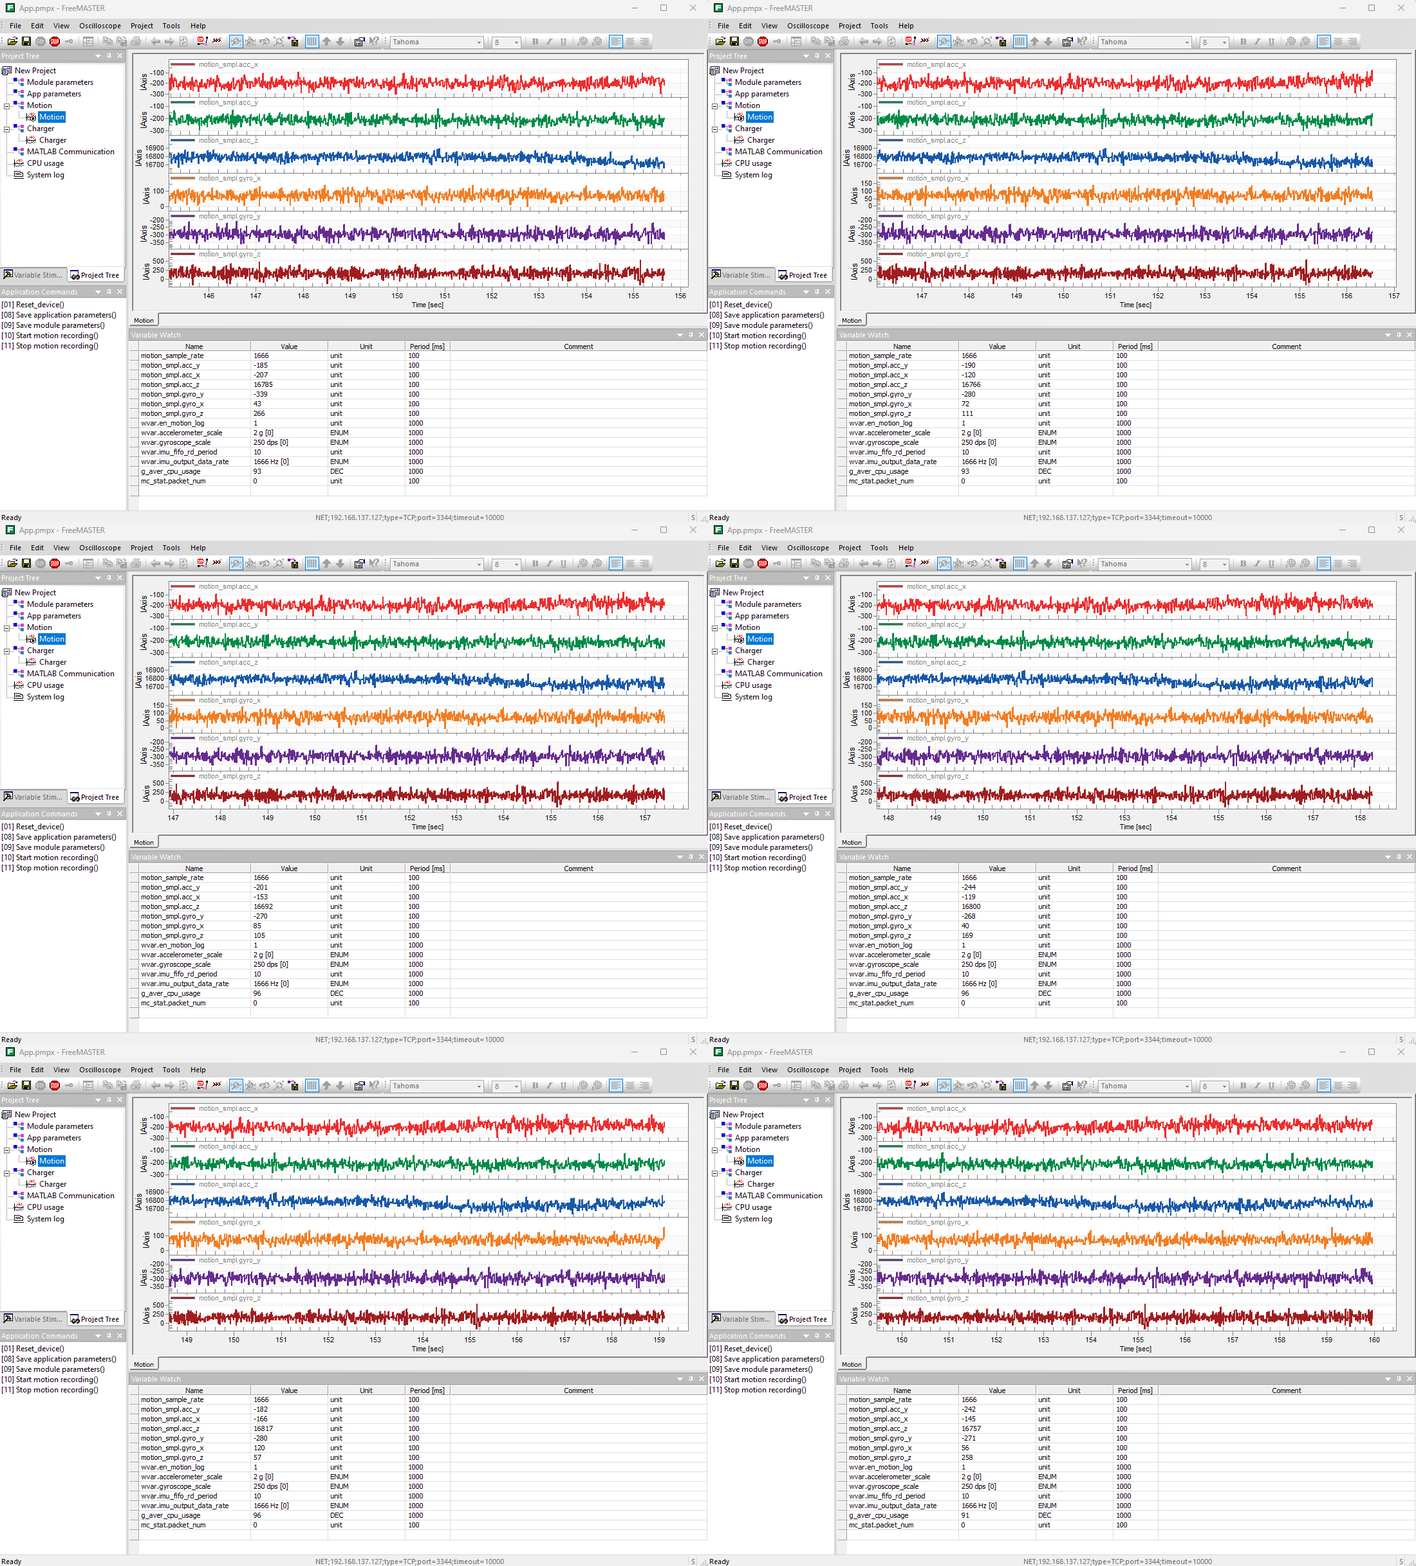
Therefore, chips like the ISM330DLC are not quite suitable for precision measurements. Below is a typical signal graph in the FreeMaster environment received from the ISM330DLC in the S7V30 module when it is at rest. Although absolute rest in a real room is poorly achievable, accelerometers respond sensitively even if the wind blows outside.
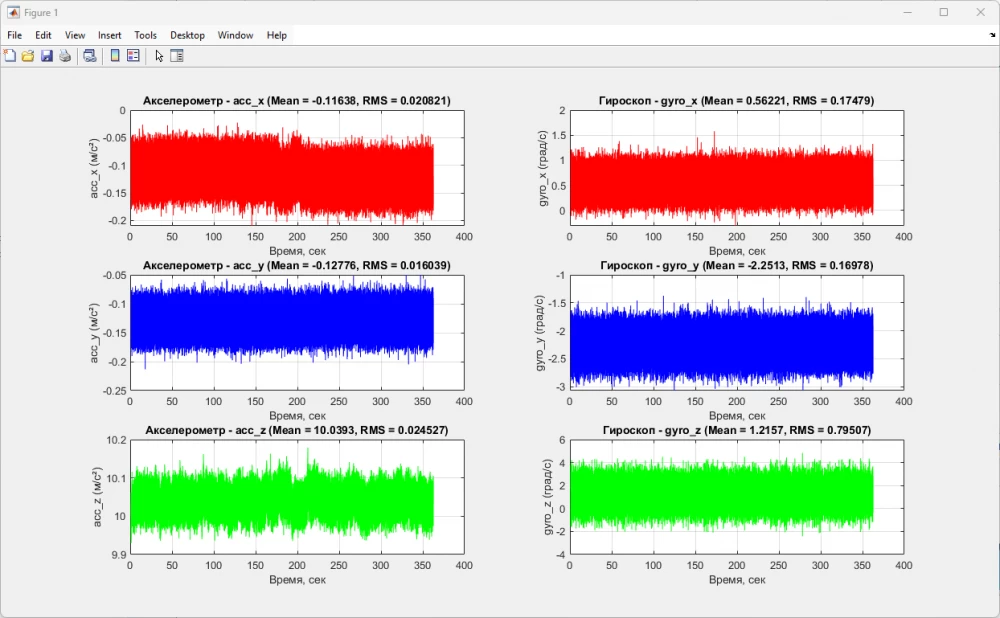
Here is a signal graph during 6 minutes of rest with calculated RMS noise and average value for each axis of the accelerometer and gyroscope:
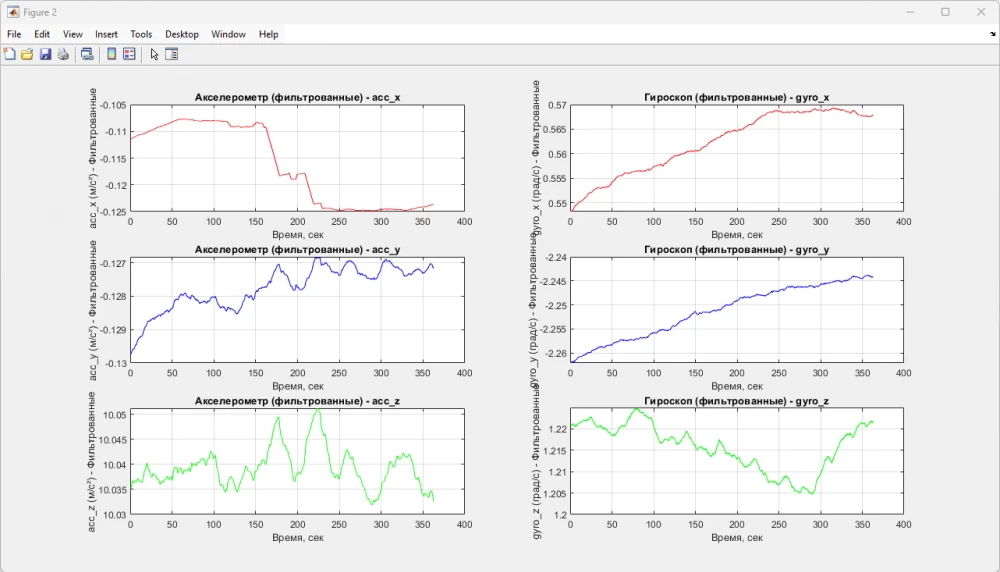
And here is a graph with the same signal, but filtered with a moving average with a window of 30 seconds. The graph shows drifts over 6 minutes
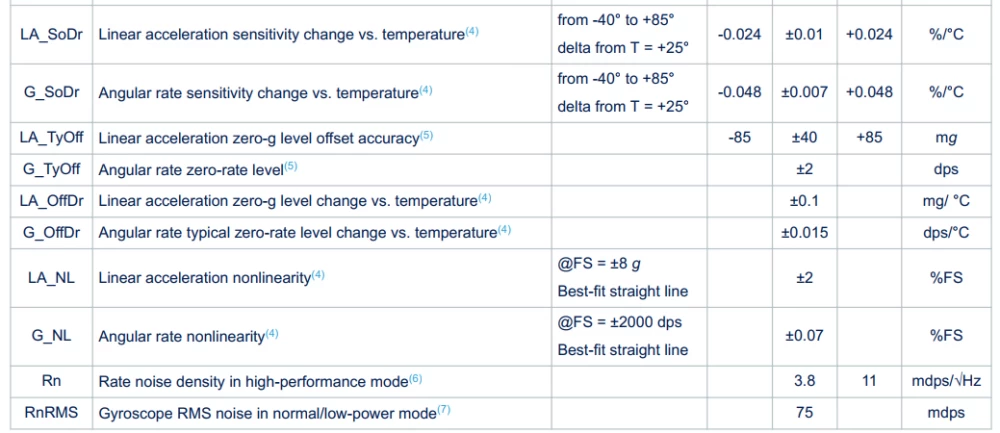
For comparison, let's see what the datasheet promises:
The gyroscope drift along the Y-axis is slightly more than the promised 2 dps (degrees per second). The RMS noise of the gyroscope is significantly higher than the declared 75 mdps and reaches 785 mdps.
The RMS noise of the accelerometer, according to calculations in the 2g range, should be about 7 mg, but in fact it reaches 24 mg.
But this is not a scientific article. Just a snapshot of what can be obtained in garage conditions. Apparently, the room, despite the silence, was quite noisy.
How the RMS noise of the accelerometer is calculated
To determine the RMS noise at a sampling rate of 1666 Hz, considering that the noise density of the accelerometer is
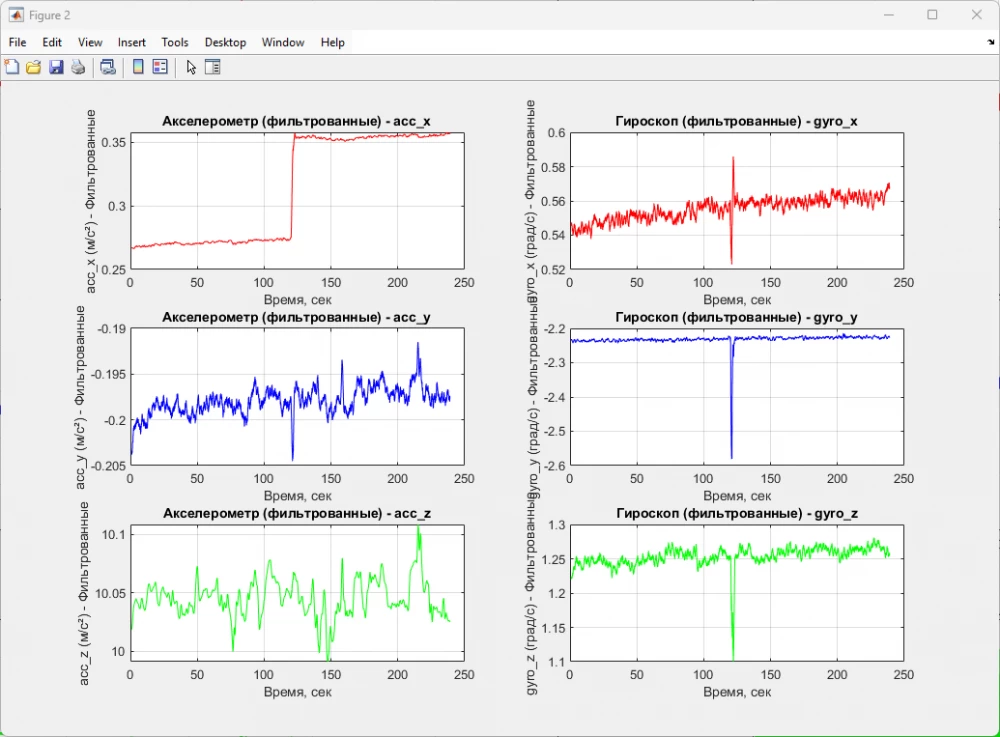
As can be seen, a change in orientation of 0.75 degrees is well recorded. Along the X-axis of the accelerometer, a distinct jump is visible, significantly exceeding the noise drift. That is, the module is quite suitable for indirect measurement of loads by the degree of flexible deformation or for fairly accurate positioning of short rotating beams in industry.
Real-time orientation visualization
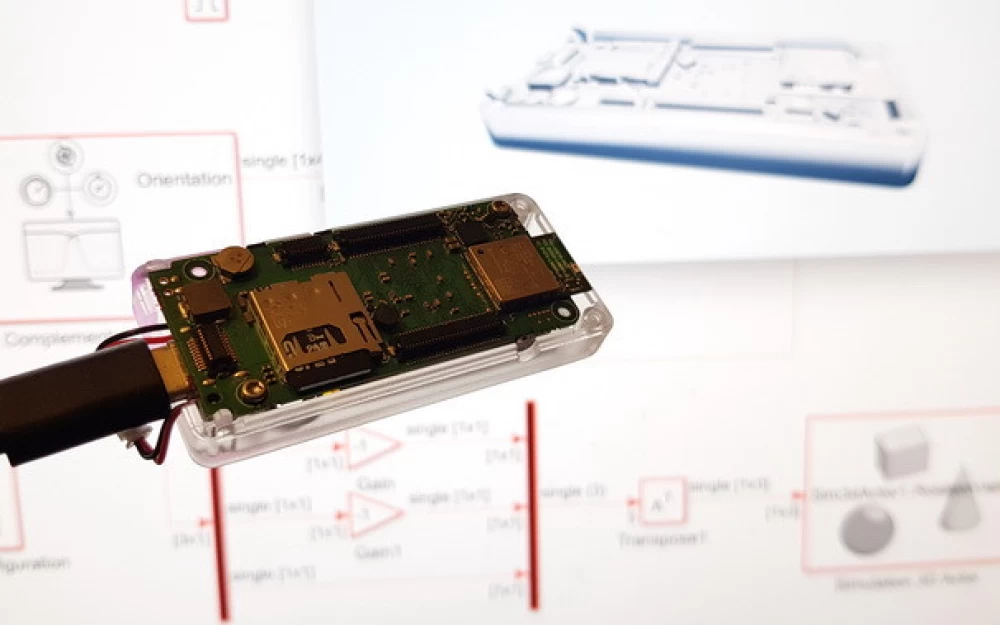
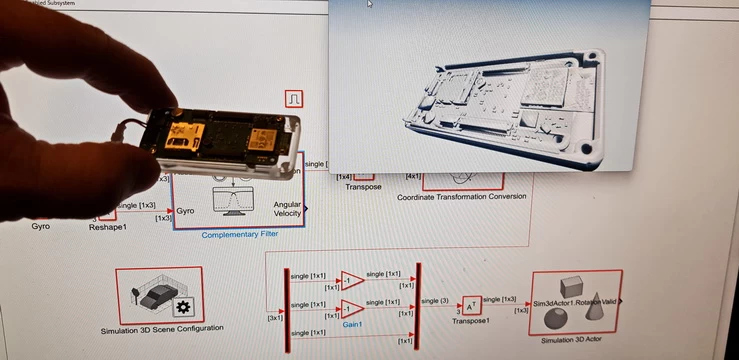
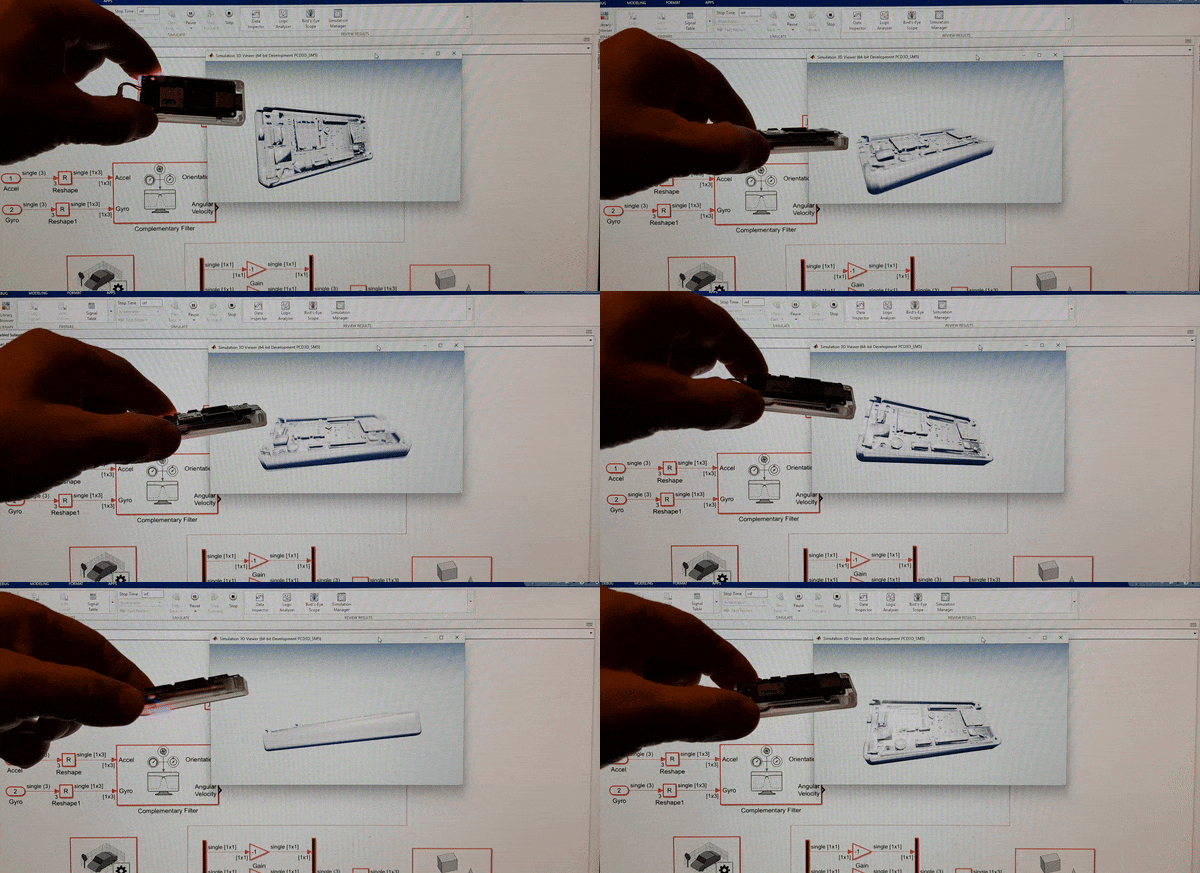
Now let's try to implement the visualization of the orientation of our module in space based on the accelerometer and gyroscope. To do this, we use the Simulation 3D Actor component of the Simulink environment and direct connection to the module via the TCP/IP protocol. As shown in my previous articles, the Matlab environment copes well with controlling external devices in real time with a cycle of 10 ms. In this case, we also choose a cycle of 10 milliseconds.
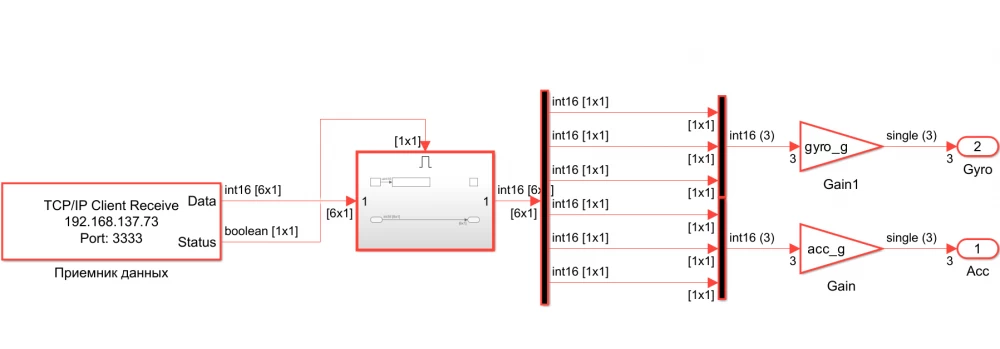
First, we build a data reception subsystem
This subsystem connects via the tcp/ip protocol to port 3333 to the module and receives raw data from it in the form of 6 two-byte words. Then synchronization with the system clock and demultiplexing of data to the accelerometer and gyroscope channels takes place. Multipliers are applied to the accelerometer and gyroscope channels to bring the values to physical values.
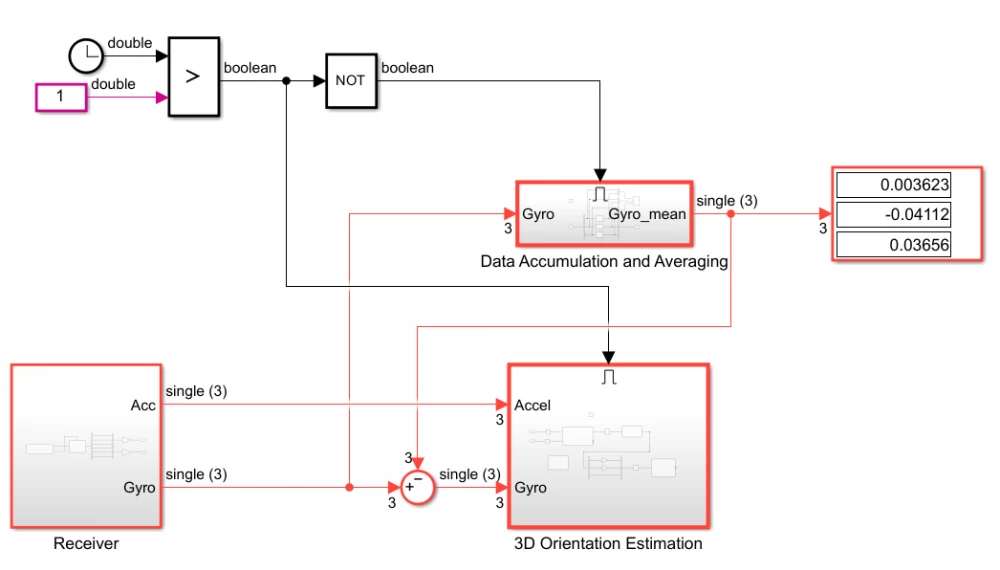
Having built the receiver in the Receiver subsystem, we complete the rest of the system
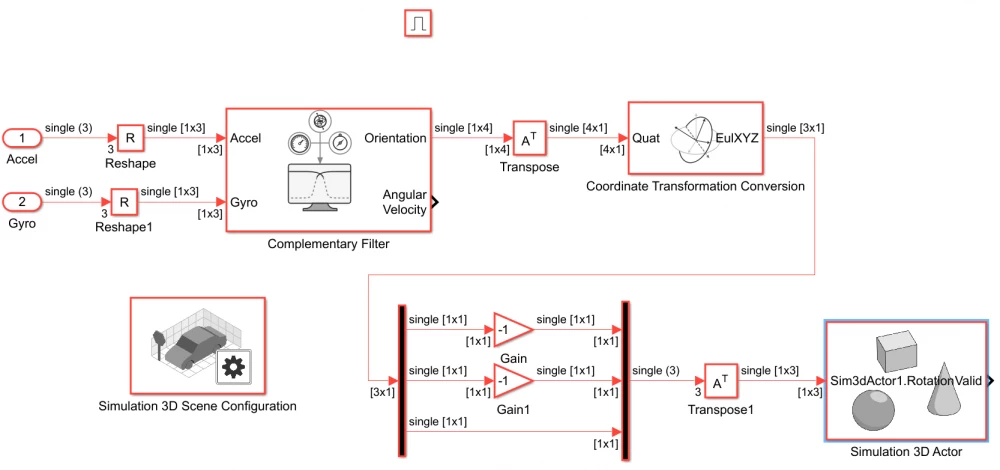
The Data Accumulation and Averaging subsystem collects and averages data from the gyroscope during the first second of recording. The three obtained constants will be used to correct the offset in the gyroscope data. After one second from the start of recording, the 3D Orientation Estimation subsystem is activated.
The main work in this subsystem is performed by the Complementary Filter block. The complementary filter is a simple, linear filter suitable for tasks where only basic stabilization and orientation are required. Simulink has more complex orientation estimation algorithms, but we will not touch them for now. Even with the complementary filter, the result was quite interesting.
This concludes my short review and I present a list of tools used for this article:
Altium Designer 24.10.1 - schematic and board
SolidWorks - 3D model in STL format for Simulation 3D Actor
Matlab 2024A - calculations, graphs, and 3D visualization
ChatGPT 4o - all scripts for MATLAB
The firmware for the S7V30 module is located here.
The MATLAB Simulink model is here





Write comment