
- Hardware
- A
Let's throttle a bit
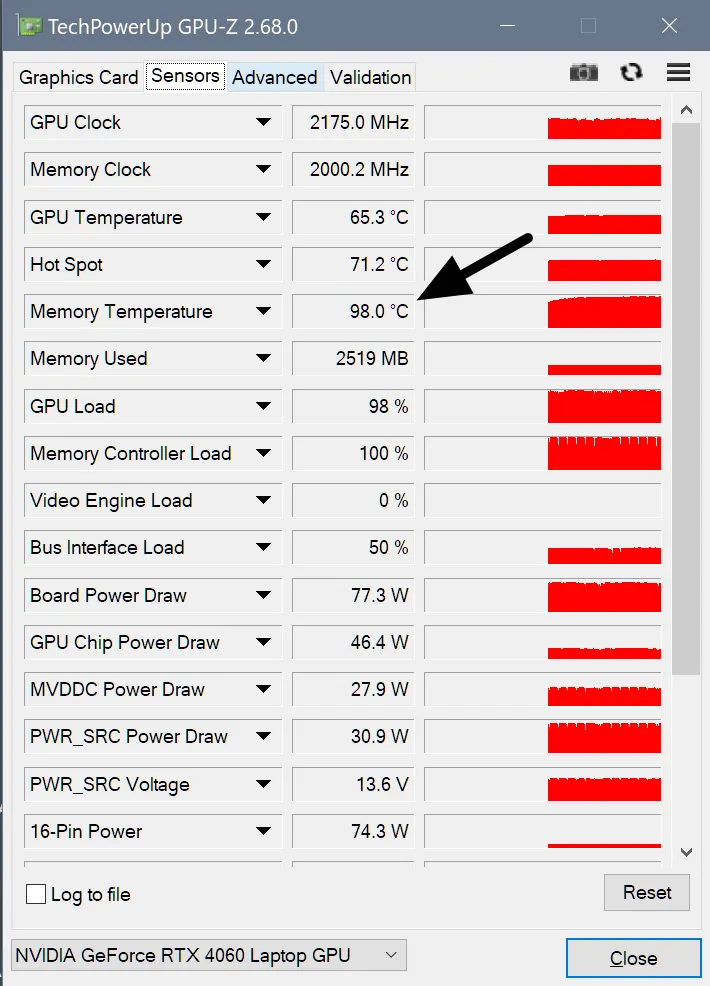
While you're upscaling videos or running LLMs, your laptop may be quietly dying. The GPU core shows a comfortable 65°C, while the video memory is sizzling at 105°C, as the factory logic only monitors the core. I'm explaining how I wrote a utility called VRAM Guard in Python to save the golden hardware from degradation using the impulse throttling method. Here's how it works...
In 2026, your laptop is not just a gadget, but a risky investment that could literally melt down due to a single neural network. While you upscale videos, your hardware is working itself to the bone. And factory cooling systems often "go blind": they simply do not see how the video memory (VRAM) is heating up to critical 105°C, while the graphics core appears to be cool. All this is against the backdrop of TSMC raising prices again, and memory chips skyrocketing due to the AI boom. Any mistake is a financial disaster. The shortage of spare parts turns repairs into a quest, and replacing a soldered GPU today costs as much as a plane wing.
Let me say right away. This article is not for gamers. It is for those who run local LLMs, Stable Diffusion, or heavy Topaz packages on their laptops, like I do. These tasks load the video memory in a specific way: intensely, continuously, for hours. The laptop turns into a silent but very hot oven. Are you used to trusting automation? I have some news for you: in the world of neural networks, silence from the fans is a bad sign. It means that the controller is looking at a cold core while the memory next to the heat pipe slowly degrades, "drying out" the thermal pads.
Unfortunately, we can't re-solder the radiator in a closed case. However, we can change the logic of its operation. Here, I will share my experience in creating a utility called VRAM Guard in Python, which works using the "impulse throttling" method. We will figure out why classic monitoring is powerless against neural networks and how short forced pauses in GPU operation can give your "golden" hardware a few extra years of life.
"What’s your problem?"
Neural networks load the graphics card differently than games. AI upscalers "hammer" the video memory (VRAM) at 100%, while the core itself (GPU Core) might only be loaded halfway.
In most laptops (hello, MSI), the cooling system is shared. And here lies the trap:
The GPU core is relatively cool (60–70°C).
The fans look at it and lazily spin at 30–40%.
The video memory meanwhile is frying at 100–105°C*. For GDDR6, the throttling limit is usually around 105-110°C, so 100°C is already in the "red zone," even though the card does not shut down yet.
I call this "quiet overheating." The turbines don't howl, the casing doesn't burn your hands, but the memory chips are slowly but surely degrading. And the thermal pads start to "leak," turning into useless mush.
By the way, what solutions are available on the market?
At first, I honestly tried to make do with ready-made software:
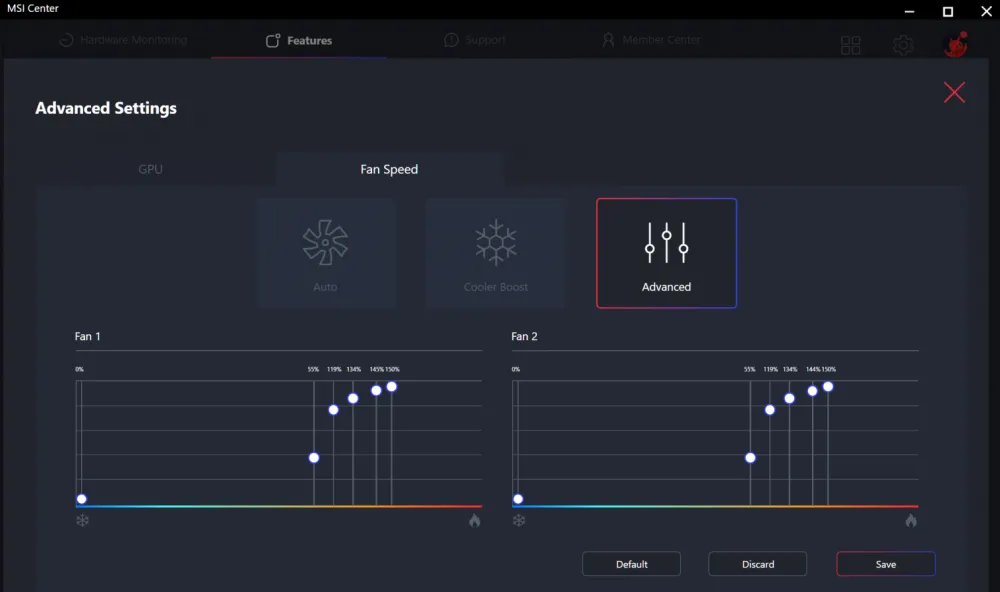
MSI Center / Dragon Center: beautiful interface, even got some kind of medal. Allows you to crank the fans up to maximum. It helps, but listening to that howl 24/7 while processing a batch of photos is quite an experience. And the automation only monitors the core anyway. In short, throw it away.
MSI Afterburner: shows temperature great, but can't throttle based on memory sensor. Conclusion: miss.
ThrottleStop: a godsend for the CPU, but useless for video memory. Verdict: not our case.
NVIDIA factory throttling: triggers when it's already too late, and cuts frequencies so abruptly that the software sometimes crashes with an error. Result: thanks, but no thanks.
If you want to do it..., do it yourself
I needed a solution that hits three targets:
Sees the temperature specifically of the memory. The native utility
nvidia-smion most laptops simply ignores this sensor. I needed to reach the real indicators of GDDR6/X, where those 100+ degrees are hiding.Works in the background, without manual intervention. I didn't want to turn on "vacuum cleaner mode" via Fn+Up every time (I love staying up late, yes) or switch profiles. The solution should work on the principle of "set it and forget it": quietly sitting in the tray and reacting to overheating on its own.
Cools effectively without killing the process. Classic throttling is too crude—it cuts frequencies, which can crash CUDA instances. I needed a method that lets the radiator "breathe," but keeps the overall task alive.
So, let's go.
This isn't how it works!
Idea #1: Throttle the process by CPU.
The first thought was simple: limit the upscaler's access to the CPU through nice and cpu_affinity. The logic is this: if the program feeds the graphics card data slower, it will cool down.
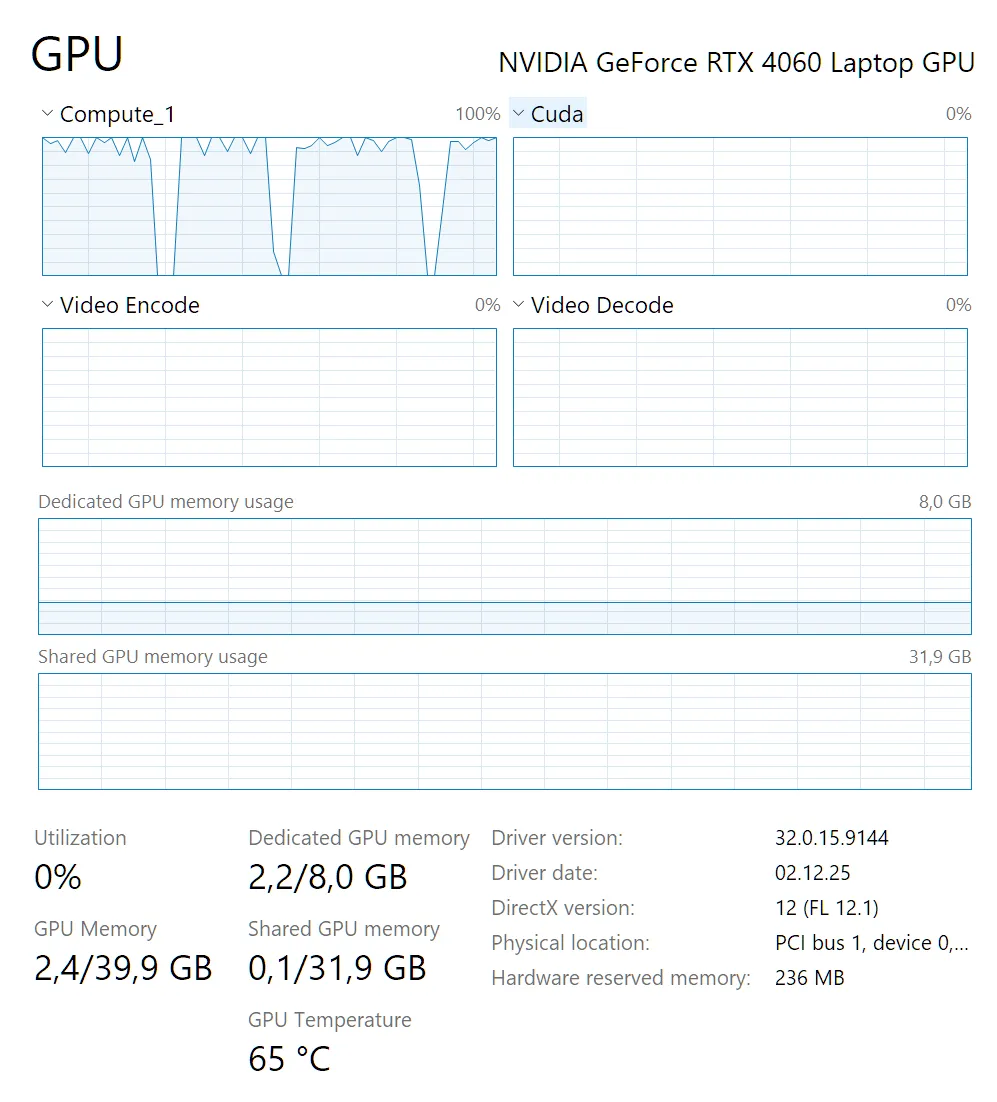
Result: complete failure. AI frameworks use the CPU as a dispatcher: it prepares a batch of data and sends it to the GPU as one heavy task. Once the command is sent, the graphics card goes full throttle, regardless of how "choked" the processor is. I left the program with one core at minimal priority — the VRAM was still heating up to 98°C. It became clear: the influence should not be on the task provider, but on the executor.
Idea #2: Monitor via nvidia-smi.
The next step is NVIDIA's "Swiss Army knife." I thought a simple query would suffice to get all metrics.
Result: missed again. It turned out that in mobile drivers, NVIDIA intentionally cuts the output. On desktops, nvidia-smi shows everything, but on laptops — only the core temperature, ignoring VRAM. The sensor exists, GPU-Z sees it, but it's inaccessible from the script. Automation without data is like reading tea leaves, isn't it?
Hooray, it worked: the "Pulse Throttling" method
When soft methods failed, I decided to play hard. The tactic is Stop-and-Go. If we can't make the graphics card work at half power, we will make it work at full power but with breaks. Like interval running: a short sprint followed by rest.
How VRAM Guard works:
The script connects to the web server LibreHardwareMonitor (it can read the deepest sensors). Important: Remote Web Server must be enabled in LHM on port 8085, this is mentioned in the Readme.
Once the VRAM reaches a threshold (e.g., 92°C), the script finds all processes that are loading the GPU.
def control_apps(action):
    # Get a list of all PIDs currently using the GPU via nvidia-smi
    pids = get_gpu_pids()

    for pid in pids:
        try:
            proc = psutil.Process(pid)
            if proc.name().lower() in PROCESS_EXCLUSIONS: continue

            if action == 'suspend':
                proc.suspend()  # Fully stop the process
            else:
                proc.resume()   # Resume the process
        except: continue
The
suspendcommand (freezing the process) is applied. At this moment, the GPU stops receiving tasks, and its consumption drops from 80W to 10–15W. This gives the cooling system precious seconds to blow out the heat.
Then — the resume command. The program continues its work.
The cycle repeats until the temperature stabilizes.
if self.current_temp > self.T1:
    self.throttling = True
    # Pulsing cycle: cool down for 3 seconds, run for 2 seconds
    self.control_apps('suspend')
    time.sleep(3.0)

    self.control_apps('resume')
    time.sleep(2.0)
This creates a "sawtooth" load graph. The average temperature drops by 10–15 degrees, and the program (yesss!) does not crash.
In the final algorithm, I set the cycles so that at 92°C, the script freezes the process for 3 seconds and lets it work for 2 seconds. Due to the thermal inertia of the VRAM heatsink, it does not instantly jump back up. The average temperature stabilizes around a safe 89°C.
Yes, the overall processing time increases. And you know what? It’s worth it. Personally, I’m okay with waiting 5 minutes. But we gain full control over the temperature and do not allow the hardware to operate at a loss. What do you think about that, Mr. Huang?
Underwater silicon stones
Where would we be without them.
"Program not responding" effect: A hard freeze of the process (
suspend) hangs its main thread. For Windows, it looks like a fatal hang: the window turns white, with "Not Responding" in the title. This is purely a visual effect that disappears afterresume, but it’s a bit scary at first. (I repeat: the program does not hang!)Battle for sensors on startup: The most complex bug. If monitoring is started together with Windows, a "race condition" occurs. The proprietary software (MSI Center) and my script both try to access the controller at the same time. As a result, my monitor crashes with a .NET error, leaving a herd of dead icons in the tray. This was resolved with a 30-second delay for "warming up" and a separate watchdog thread that restarts the monitor if it crashes
into a faint.Access rights: Working with hardware and other processes requires administrator rights. A regular shortcut in the autostart will not work, I’ll say it straight. I had to configure the launch through Task Scheduler with the flag "Run with highest privileges".
Zombie icons in the tray: After each monitor crash, a ghost icon remained in the tray. To avoid cluttering it, I added aggressive cleanup to the batch loader: before each start, the script kills all old instances of itself and the monitor.
This is good, and here’s why
As a result, we choose not the "lesser of two evils," but simply a different mode of operation.
On one hand — stable 100°C. This is the "thermal soaking" mode, where not only the chip heats up, but also the entire board around it. Guaranteed degradation of thermal pads and a slow death of memory chips. For a workstation, this is a path to failure in about a year or so.
On the other hand — our "saw" (82°C – 94°C). Yes, the temperature fluctuates, but within a narrow working range. For electronics, this is a standard situation, much like in gaming. Moreover, the average temperature drops by 10–12 degrees, and the peaks no longer enter the "red zone." We simply take control where the factory automation is powerless.
Something like a conclusion
As a result, we have created a utility called VRAM Guard — a small but effective "brake pedal" for a laptop that decided to become a blast furnace. Set the threshold once — and you can leave heavy tasks running overnight without fear of finding a "brick" instead of a computer in the morning.
If you're also pushing neural networks, upscale processing, or heavy rendering on your laptop — check the memory sensors. Perhaps your hardware has long been begging for mercy.
The project is open, with source code and instructions available on GitHub. I would appreciate your stars, pull requests, and stories about how many degrees you managed to "cut off."
You can download it here: GitHub: Yp-pro/VRAM-Guard
Stay cool under the hottest tasks!

![From Virtual Hands to AI for Survivalists: Curious Open Agent OSes [and One Hardware Project]](https://cdn.tekkix.com/imgs/2026/05/habrcom/big/ce0b1057616faed51cd8b9f3b2b9.webp)


Write comment