- Security
- A
Profiling: comparing pt-pmp and perf tools on real examples
Hello, tekkix! In the previous article, the primary analysis of the application was discussed, which tools should be used to collect information and how to work with these tools. Let me remind you that we were talking about two utilities: poor man's profile, which allows you to comprehensively evaluate the application's performance by displaying off-cpu and on-cpu parts; and perf, which has high accuracy and powerful functionality overall. Both of these tools are used for performance analysis, as their combination allows you to examine the "patient" from all sides.
Only part of the flame graph is displayed here, namely the methods of the consumer threads (the root method is Workers::ExecuteTask). It can be seen that consumers spend about 77% of the time processing the package, the remaining 23% waiting for the mutex to unlock, thereby blocking each other's work. It becomes clear that to optimize the work of consumers, it is necessary to reduce the time during which they are idle and direct these resources directly to working with messages.
Problem Solving
An effective way to speed up the work of threads in the given example is to change the concept of std::conditional_variable + std::list and completely remove the work with mutexes. An excellent option seems to be a lock-free queue — this is a data structure designed to store elements without using locking mechanisms. The lock-free queue uses atomic operations and other synchronization methods that allow multiple threads to simultaneously add and remove elements from the queue without blocking each other (more details about such queues can be found in this article).
In the case of the SysLog module, the queue should meet the following requirements:
comply with the
single producer — many consumerspattern;be limited: you cannot add an infinite number of messages to the queue;
have the ability to block threads: if the queue is empty, consumer threads should wait for a new message. If the queue is full, the producer thread should wait for a new space.
This description fits concurrentqueue — it is an implementation of a lock-free queue based on sequential blocks instead of linked lists. It consists of a set of subqueues, one for each producer. When a consumer thread wants to read a message from the queue, it checks all the subqueues until it finds one that is not empty (in our case, only one subqueue is used, as there is only one producer). A more detailed description with implementation details and benchmarks can be found in the article by the library author.
After integrating the queue, the producer thread code looks like this:
// Create the queue (using the thread-blocking variant)
static constexpr std::size_t EXPLICIT_PRODUCERS_NUMBER = 1;
static constexpr std::size_t IMPLICIT_PRODUCERS_NUMBER = 0;
static moodycamel::BlockingConcurrentQueue m_queue{queueSize, EXPLICIT_PRODUCERS_NUMBER, IMPLICIT_PRODUCERS_NUMBER};

// Create a token for the producer thread
static moodycamel::ProducerToken token(m_queue);

// Enqueue the message
if (!m_queue.try_enqueue(token, std::move(message)))
    m_queue.wait_enqueue(token, std::move(message));
Initially, the try_enqueue method is used, which places the message in the queue if there is space. If there is no space, the wait_enqueue method is called, which will do so when space becomes available. At the time of writing, BlockingConcurrentQueue does not contain this method, so I implemented it as follows:
// Send the stream to "sleep", then try to add a message to the queue.
// The waiting time doubles with each subsequent iteration.
inline void wait_enqueue(producer_token_t const& token, T&& item)
{
    auto sleepTime = 100;

    do
    {
        std::this_thread::sleep_for(std::chrono::nanoseconds(sleepTime));
        sleepTime = std::min(sleepTime * 2, 10000000);

    } while (!add_item_busy_wait(token, std::move(item)));
}

// Try to add a message to the queue. If there is no space, use spin lock to wait
// (it is assumed that space in the queue will appear quickly and a short pause will be enough)
bool add_item_busy_wait(producer_token_t const& token, T&& item)
{
    for (auto i = 0; i < 1000; i++)
    {
        if (try_enqueue(token, std::move(item)))
            return true;
        _mm_pause();
    }

    return false;
}
Below is the consumer thread code:
static constexpr std::int64_t QUEUE_WAITING_PERIOD_USEC = 100000;
// Create a token for the consumer thread
thread_local moodycamel::ConsumerToken token(m_queue);

while (!m_Stopped)
{
   Message message;

    if (!m_Tasks.wait_dequeue_timed(token, message, QUEUE_WAITING_PERIOD_USEC))
        continue;

    message.process();
}
The logic here is simple: wait for a message in the queue, read it, and process it.
Optimization Testing
Now let's see how the flame graphs have changed after adding the patch. pt-pmp showed the following results:
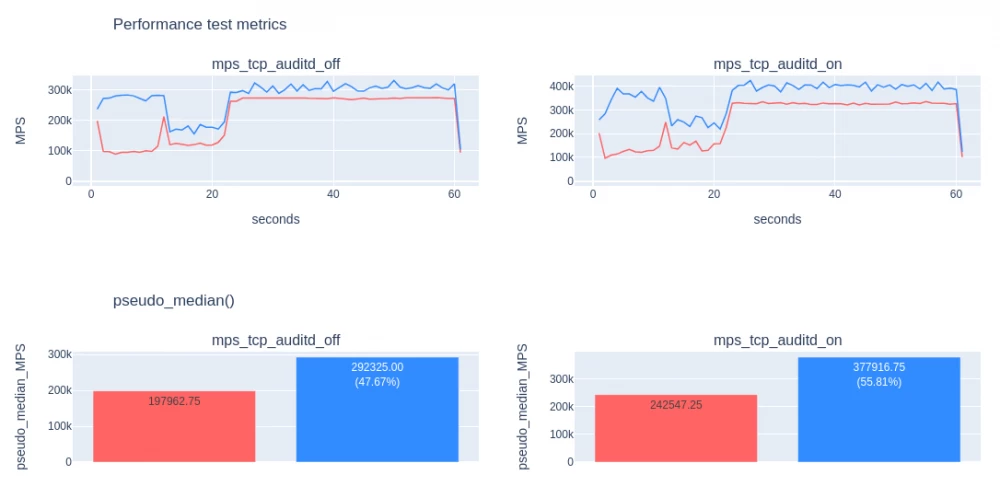
It can be seen that message processing now takes 97.5% of the time, waiting has significantly decreased, mutex locks are not visible on the graph, as a lock-free queue is used. Compared to the previous version, the SysLog module is now about 50% faster. Below are the results of comparing the two versions through MPS (messages per second). The version before optimization is marked in red, the version after is in blue:
Comparison with perf flame graphs
It remains to answer the question: what does the flame graph based on perf show in this case? Would it be possible to find the described optimization if only the on-cpu profiler was used?
Answer: the flame graph based on perf is not enough. This is what the consumer's work looks like from the point of view of perf:
There are no locks here at all, in which the consumer actually spends quite a lot of time. It creates the impression that the thread only processes messages and is almost not in a waiting state.
Now let's look at the perf flame graph after the introduction of the lock-free queue:
The picture has not changed much, we see 97% of useful work compared to 95.5%. It can be concluded that for analyzing the application from the point of view of the off-cpu part, pt-pmp is more suitable than perf.
Using perf
The main advantage of this profiler compared to pt-pmp is higher measurement accuracy, so let's consider an example where this feature was useful. We will analyze the event normalizer (MaxPatrol SIEM component), its main task is to convert all events into one form so that other components can correctly process it afterwards.
Case conversion problem
One of the popular methods used in normalization is converting a string from uppercase to lowercase. The code is based on the open-source ICU library:
inline static std::string toLowerIcu(std::string_view src) {
    static UErrorCode err = U_ZERO_ERROR;
    static const UCaseMap *csm = ucasemap_open(nullptr, U_FOLD_CASE_DEFAULT, &err);
    std::string dst(src.size(), char{});

    ucasemap_utf8ToLower(csm, dst.data(), static_cast(dst.size()),
        src.data(), static_cast(src.size()), &err);

    return dst;
}
On the perf flame graph, the transformation looks as follows:
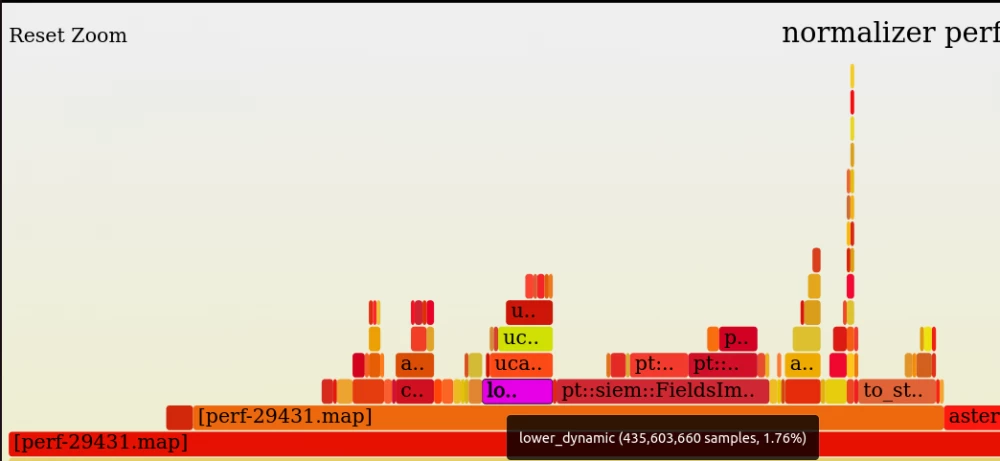
It is evident that it consists entirely of the ICU function and takes up 1.5–2% of the total runtime, so there is room for optimization here.
Solution Preparation and Testing
One of the features of the normalizer is that it must correctly handle both ASCII format strings and a broader set of UTF-8 format strings (which is why ICU is used). However, this method is quite slow, especially for ASCII strings. To convert such a string from uppercase to lowercase, it is sufficient to call the standard tolower function, which works faster. But first, you need to make sure that the input string is in ASCII format.
The updated conversion code looks like this:
// Helper function to check ASCII string
inline static void isAsciiAndLowercase(std::string_view str,
                                       bool &isAscii,
                                       bool &needsConvToLower)
{
    const uint8_t *pos;
    size_t len;
    uint64_t acc1 = 0;
    uint64_t acc2 = 0x2020202020202020UL;

    // It is assumed that the input to this function is short enough,
    // so scanning the entire string in a vectorizable loop should be
    // faster than checking conditions inside the loop to exit it earlier.
    //
    // The following assumptions are used:
    //
    // - all ASCII characters (and only them) have the most significant bit
    // (bit #8) of their first and only byte set to 0;
    //
    // - no uppercase ASCII character has bit #6 set
    // ('A' - 'Z' are encoded in binary values 0100 0001 - 0101 1010).
    // This means that if bit #6 is set for all characters, the string
    // will definitely not contain uppercase characters
    // and therefore will not need to be converted to lowercase
    // (needsConvToLower == false);
    //
    // - Conversely, if all characters in the string are less than 64
    // (i.e., their bit #7 is cleared), no conversion is required;
    //
    // - if both conditions above are false, the string may or may not have
    // uppercase letters, but the function will return (needsConvToLower == true),
    // i.e., false positives for this check are possible,
    // but not false negatives.

    for (pos = (const uint8_t *)str.data(), len = str.length(); len >= 8;
         pos += 8, len -= 8) {
        uint64_t val = *(const uint64_t *)pos;
        acc1 |= val;
        acc2 &= val;
    }

    uint8_t acc3 = 0x20;
    for (; len > 0; pos++, len--) {
        acc1 |= *pos;
        acc3 &= *pos;
    }

    isAscii = (acc1 & 0x8080808080808080UL) == 0;
    needsConvToLower =
        !((acc1 & 0x4040404040404040UL) == 0 ||
          ((acc2 & 0x2020202020202020UL) == 0x2020202020202020UL &&
           (acc3 & 0x20) == 0x20));
}

// ASCII string conversion function
inline static std::string asciiToLower(std::string_view src) {
    std::string dst(src.size(), char{});

    for (size_t i = 0; i < src.size(); i++) {
        dst[i] = ::tolower(src[i]);
    }

    return dst;
}

// Conversion function with ASCII string check
inline static std::string toLowerAscii(std::string_view src) {
    bool isAscii;
    bool needsConvToLower;

    pt::isAsciiAndLowercase(src, isAscii, needsConvToLower);
    if (isAscii) {
        return needsConvToLower ? asciiToLower(src) : std::string{src};
    }

    // Call the original ICU-based method
    // if the string does not fit the ASCII format
    return toLowerIcu(src);
}
Let's compare its performance on a microbenchmark:
$ lscpu
...
Vendor ID:            GenuineIntel
CPU family:           6
Model:                62
Model name:           Intel(R) Xeon(R) CPU E5-2695 v2 @ 2.40GHz
...

$ ./bin/benchmark_string_upper_to_lower
2024-07-29T12:31:18+00:00
Running ./bin/benchmark_string_upper_to_lower
Run on (12 X 2400 MHz CPU s)
CPU Caches:
  L1 Data 32 KiB (x12)
  L1 Instruction 32 KiB (x6)
  L2 Unified 256 KiB (x6)
  L3 Unified 30720 KiB (x0)
Load Average: 4.60, 4.39, 3.88
------------------------------------------------------------
Benchmark                  Time             CPU   Iterations
------------------------------------------------------------
IcuConversion        1815000 ns      1815000 ns          314
ToLowerConversion     837000 ns       836966 ns          835
It can be seen that the optimized algorithm works approximately twice as fast as the original version. Now let's see how this is reflected in the perf flame graph:
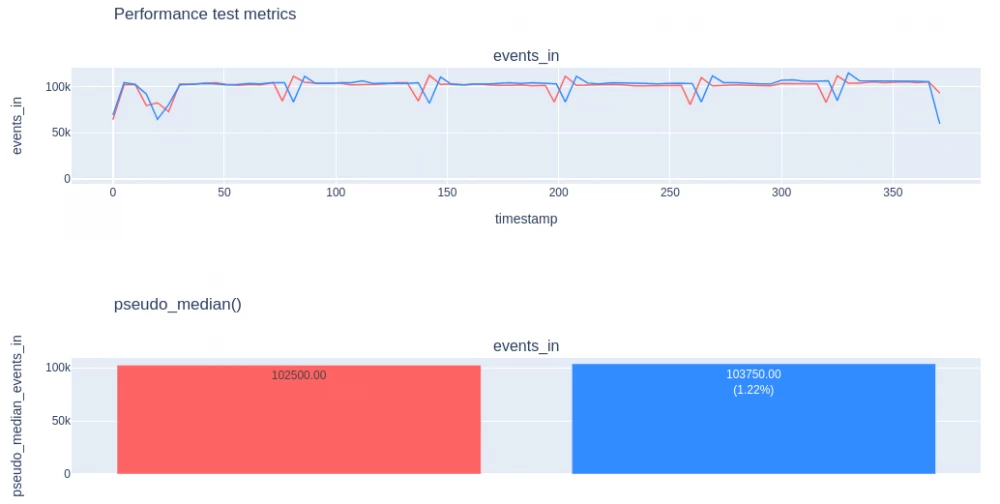
The method takes about 0.6% of the total time, which is one percent less than the original version. This also affected the overall EPS (events per second) of the normalizer, speeding it up by about 1%.
Comparison with pt-pmp flame graphs
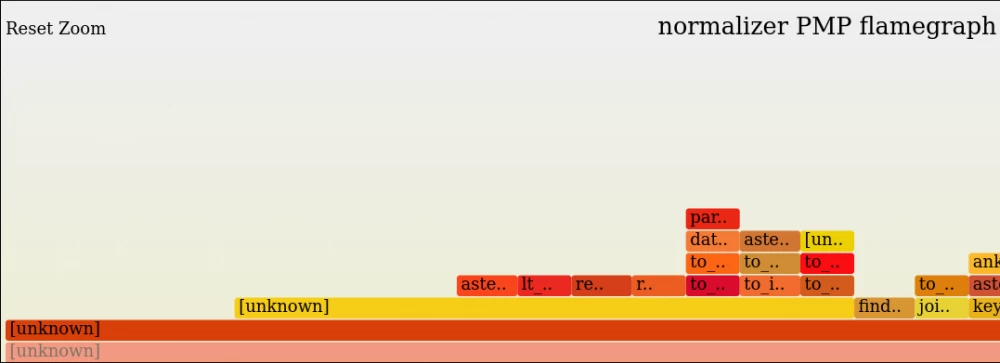
If only pt-pmp was used as a profiler, the conversion problem would be difficult to detect, as it is less accurate compared to perf and does not show the lower method on the flame graph.
It looks like this:
For clarity, I will duplicate the perf flame graph before optimization, only with the same scale as pt-pmp, to see the difference exactly:
It can be concluded that it is better to use perf rather than pt-pmp to find local optimizations.
Conclusion
The described examples demonstrate the strengths and weaknesses of pt-pmp and perf and show when and in what cases each of them was applied in practice. As already mentioned in the first part of the article, we do not need to choose just one; an effective option is to use both profilers at once, thus it will be possible to analyze the application from different perspectives: both in terms of thread interaction and various expectations, and in terms of pinpoint optimizations and acceleration of specialized algorithms.
It is worth clarifying: although the performance in the examples differs (with the help of pt-pmp it was possible to find an optimization of 50%, and 1% with the use of perf), this does not mean that perf is weaker and should not be used. The emphasis here is on the strengths and weaknesses of these tools, as it is difficult to find problems with pt-pmp, the closure of which will give a 1-2% increase. But there can be many such problems, and if they are gradually corrected, the performance of the application will noticeably accelerate.
Application
Microbenchmark code for string conversion:
#include
#include
#include
#include

#include
#include

static constexpr size_t STR_MAX_SIZE = 100;
static constexpr size_t VECTOR_SIZE = 3000;

static std::string getRandomString(size_t length)
{
    static constexpr std::string_view CHARACTERS = "0123456789ABCDEFGHIJKLMNOPQRSTUVWXYZabcdefghijklmnopqrstuvwxyz";
    std::default_random_engine generator;
    std::uniform_int_distribution<> distribution(0, CHARACTERS.size());

    std::string string;
    string.reserve(length);
    for (std::size_t i = 0; i < length; ++i)
    {
        string.push_back(CHARACTERS[distribution(generator)]);
    }

    return string;
}

static std::vector getRandomStringVector() {

    std::default_random_engine generator;
    std::uniform_int_distribution<> distribution(1, STR_MAX_SIZE);
    std::vector vector{VECTOR_SIZE};

    std::generate(vector.begin(), vector.end(), [&generator, &distribution


Write comment