- Security
- A
Find out what the user did through the registry dump
When investigating computer incidents, one of the most important actions is the collection of evidence. So it is very important for us to have a dump of the RAM, because from it you can get information about which processes were running in the system, and, for example, you can select and dump processes created by malware for further analysis of this dump.
Also, information about which applications the user launched, which documents he opened in office programs, which network connections he established with external resources using protocols such as RDP and SSH is of great importance. And the Windows registry can help us solve these and similar tasks.
The Windows registry is a hierarchically structured database of parameters and settings in Microsoft Windows operating systems. The registry contains information and settings for hardware and software, user profiles, presets, etc. Most changes in the Control Panel, file associations, system policies, the list of installed software are recorded in the registry. Thus, the registry contains a lot of important information.
Virtual Registry
When the computer starts, it takes information from the hardware from the registry files and forms the so-called virtual registry in the machine's RAM. It is in this virtual registry that the current configurations are stored, and it is from the virtual registry that changes in the system are transferred to the file, which are then saved to the hard disk. Since this interaction process lasts throughout the entire session of the operating system, the virtual registry is constantly in the computer's memory.
The virtual registry can be very useful when analyzing user actions, as it allows us to learn a lot of interesting things about user actions in the system. For example, you can get information about groups and users, including rights, passwords, the date of the last login to the system, connected USB devices, installed programs, recently viewed documents, most frequently launched programs, and much more.
Next, we will talk about using Volatility to work with the virtual registry and obtain useful information about user activity.
Good old Volatility
The Volatility tool is probably the most common means of analyzing memory dumps. With this tool, we can analyze information from the virtual registry saved in the memory dump. In this article, I will not describe the process of installing this tool, as there are enough publications on this topic.
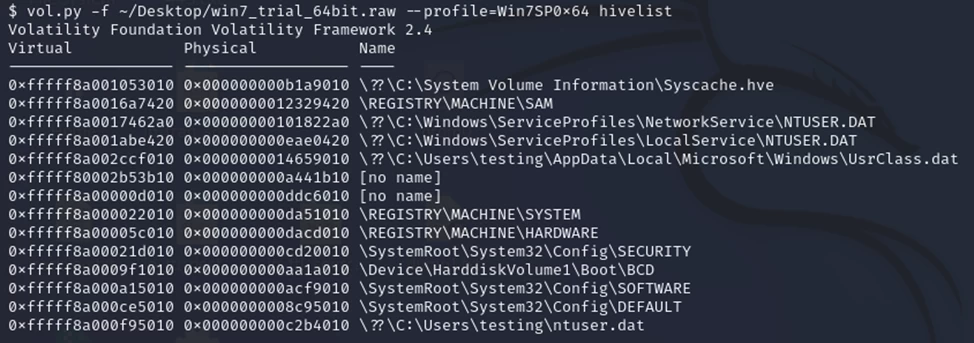
There are various plugins for working with the registry in Volatility. Let's start with Hivelist. This plugin allows you to find the virtual addresses of registry nodes in memory and the full paths to the corresponding node on the disk. If you want to print the values of registry branches starting from a specific node, first run this command to see the node addresses.
$ vol.py -f win7_trial_64bit.raw --profile=Win7SP0x64 hivelist
To display subkeys, values, data, and data types contained in the specified registry key, use the printkey plugin. By default, the printkey function searches all registry keys and prints the key value information (if found) for the requested key. Thus, if the key is located in multiple cells, the key information will be printed for each cell in which it is contained.
Suppose you want to navigate to the HKEY_LOCAL_MACHINE\Microsoft\Security Center\Svc key. You can do this as follows.
$ vol.py –f win7_trial_64bit.raw --profile=Win7SP0x64 printkey -K "Microsoft\Security Center\Svc"
To recursively list all subkeys in the hive, use the hive dump command and pass it the virtual address of the desired branch. You can get this address, for example, using the hivelist plugin.
Working with Accounts
The next task is relevant not only for computer forensics experts but also for pentesters. To extract and decrypt cached domain credentials stored in the registry, use the hashdump plugin.
Here, to use hashdump, pass the virtual address of the system storage as -y and the virtual address of the SAM storage as -s (also taken from the hivelist output). For example, like this:
$ vol.py hashdump -f win.raw -y 0xe1035b60 -s 0xe165cb60
Next, the obtained hashes can be attempted to be cracked using John The Ripper, Hashcat, or used in Pass The Hash attacks. But let's get back to studying user actions.
Going Back in Time with ShellBag
Shell Bags is a widely used term to describe a set of registry sections that allow the Windows OS to track user preferences when viewing windows specific to Windows Explorer. These keys can contain interesting information and can help create a clearer picture of user actions on the computer. For example, Shell Bags can contain the following information: files that were recently used and the file type (zip, directory, installer), as well as files, folders, zip files, installers that existed at some point in the system (even if they were deleted), shared network resources and folders in these shared resources, and metadata associated with these types.
Shellbags are located in different branches depending on the version of the Windows OS. According to the Microsoft Knowledge Base article (KB 813711), for Windows 7, the dump of which we use in the examples, it will be:
HKEY_CURRENT_USER\Software\Microsoft\Windows\Shell
HKEY_CURRENT_USER\Software\Microsoft\Windows\Shell\Bags
HKEY_CURRENT_USER\Software\Microsoft\Windows\Shell\BagMRU
HKEY_CURRENT_USER\Software\Microsoft\Windows\ShellNoRoam
HKEY_CURRENT_USER\Software\Microsoft\Windows\ShellNoRoam\BagMRU
HKEY_CURRENT_USER\Software\Microsoft\Windows\ShellNoRoam\Bags
Let's try to extract the Shellbag from our dump:
$ vol.py -f win7.vmem --profile=Win7SP1x86 shellbags
This is a fragment of the command output showing which files were recently run by the user.
If necessary, you can include the computer ID in the main file header with the --machine flag (this is useful when merging timelines from multiple computers).
Dump, just dump
In conclusion, let's consider the dump registry plugin, which allows you to write registry data to disk. By default, the plugin dumps all found registry files (including virtual registries such as hardware) to disk, but you can specify a virtual offset for a specific hive to dump only one registry block at a time. One of the caveats of using this plugin is that there may be gaps in the remote registry file, so standalone registry tools may fail if they are not robustly configured to handle "corrupted" files. These gaps are indicated in the text output by lines like Physical layer, returning None for index 2000, with NULL padding.
You can also dump only a single registry branch. In this case, we will again need the address from the hivelist:
vol.py -f voltest.dmp --profile=Win7SP1x86 dumpregistry -o 0x8cec09d0 -D output/
Conclusion
The plugins for working with the registry in Volatility presented in the article are far from a complete list of all the tools available in this application. Plugins such as userassist, slimcache, and others can also be useful. Moreover, besides Volatility, there are many other tools for analyzing the virtual registry.
All current methods and tools for ensuring information security can be learned in OTUS online courses: you can view the list of all programs in the catalog, and sign up for open lessons in the calendar.


Write comment