- AI
- A
Need for speed: assessment of measurement errors in football analytics. Part 1
Hello! My name is Artem, and I develop computer vision systems for the Yandex Sporttech service. Among the main tasks of our team are football analytics and working with statistical data.
Yandex Sportech has integrated technological solutions into the Russian Premier League — all stadiums of the championship participants have been equipped with 6K cameras, and clubs have been provided with real-time transfer of fitness data and advanced statistics at the intersection of technical and tactical actions. Using modern computer vision methods, we detect players and the ball, track them, and calculate various key sports metrics — distances covered, maximum speeds, sprints and bursts, as well as emergency braking and other fitness indicators important to analysts, coaches, and fans of the game.
In these two articles, we’ll take a close look at why accurate measurement of player speed and distance covered is critically important for high-quality football match analysis. We’ll explain why any systematic errors and inaccuracies can significantly distort conclusions and recommendations for the coaching staff and analysts.
We’ll also share our experience, talk about typical sources of errors that arise when calculating speed and distance, and describe approaches that help minimize their impact.
Previously, we conducted tests for measuring distance covered in different areas of the field. But our data processing algorithms and instant speed calculations have improved significantly over the last two years. Thanks to this, we’ve been able to move on to more complex exercises, which are traditionally used for FIFA certification.
Pipeline and Getting Started
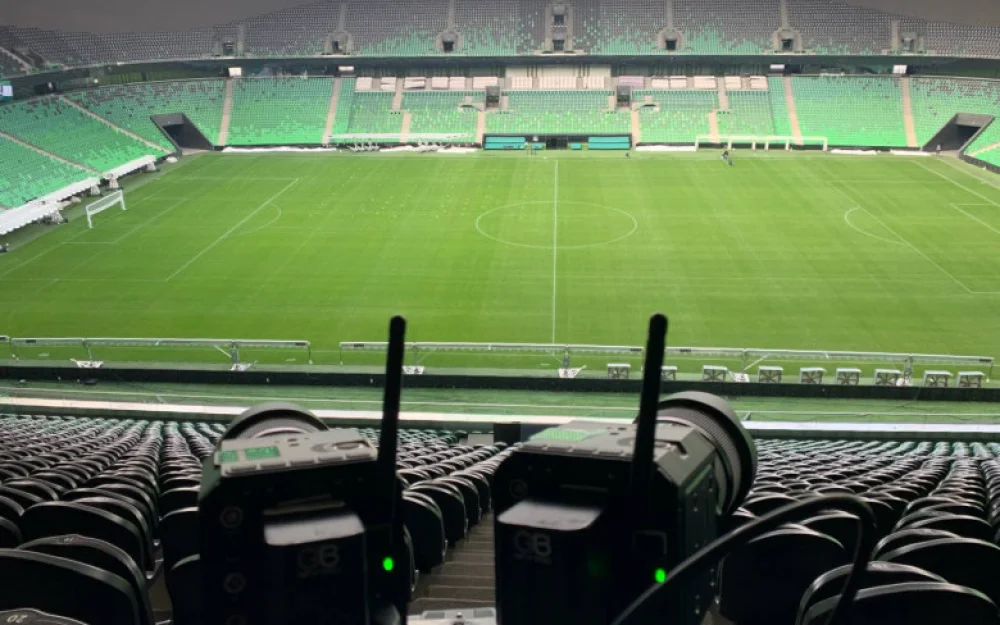
Before the test began, we carefully calibrated the cameras in the stadium, and their video streams were synchronized with high accuracy — we know down to 1/50 of a second when each half starts and ends. (Written about in more detail in these articles — one, two).
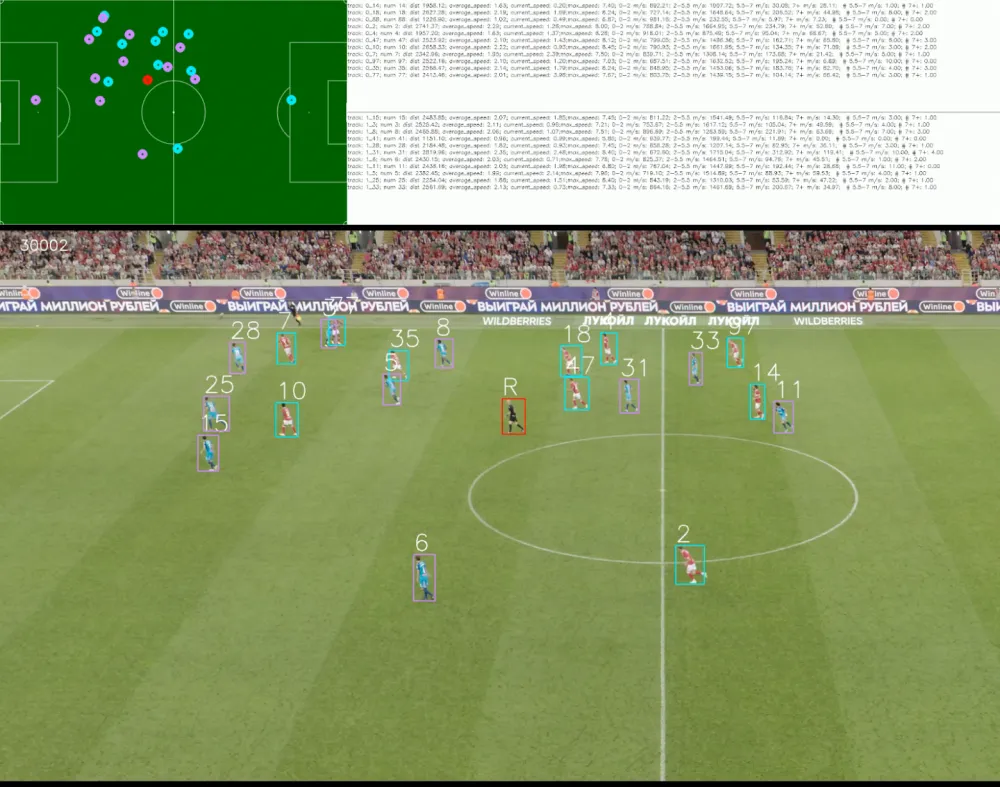
This is what our pipeline looks like.
Detection: modern computer vision algorithms make it possible to locate all players on the field even in complex situations with overlaps and occlusions.
Tracking and identification: here our system follows each player and ensures continuous tracking even in dynamic scenes.
Postprocessing: we “refine” the raw tracking, filter out false positives, and correct possible errors.
It is necessary to mention an important technical detail: we assume that a player's in-game coordinate corresponds to the center of the bottom edge of their rectangular detection (bounding box). This means that when a footballer is detected in a video frame, a rectangle enclosing their figure is assigned, and the player’s position is taken as the point in the middle of the lower boundary of this rectangle. The highlighted point most likely corresponds to the position of the feet or the center of the player’s support base on the field, allowing us to display the player’s position for movement analysis. Though this simplification is convenient for implementation, it introduces uncertainty and additional noise into localization. This is especially noticeable during sudden movements or in situations where players partially overlap.
After noise suppression and corrections comes our main calculation: fitness statistics analysis. We calculate not only overall distances and speed characteristics of players, but also more nuanced parameters: the number of sharp brakes or the number of sprints completed.
Special attention is given to the maximum speed of the player. This metric has practical significance—it allows us to judge the speed capabilities of the athlete, assess their fitness level, and even determine their tactical role on the team. Maximum speed is often discussed among coaches, commentators, and analysts because it can be used for comparison between players even at the world level.
However, from a statistical perspective, maximum speed is a rather “capricious” metric. It is highly sensitive to outliers and noise: a single erroneous peak can change the final value. This makes it particularly susceptible to distortions arising both from detection and tracking peculiarities, as well as from post-processing algorithms. In our work, we focus on finding ways to smooth and filter out such distortions so that the resulting values reflect real gameplay dynamics rather than random artifacts of computation.
Smoothing
At the post-processing stage, it was important to choose a smoothing method that removes noise but doesn’t distort actual trajectories and sharp turns. Strong smoothing erases characteristic accelerations and lowers maximum speeds, while weak smoothing doesn’t eliminate outliers and noise.
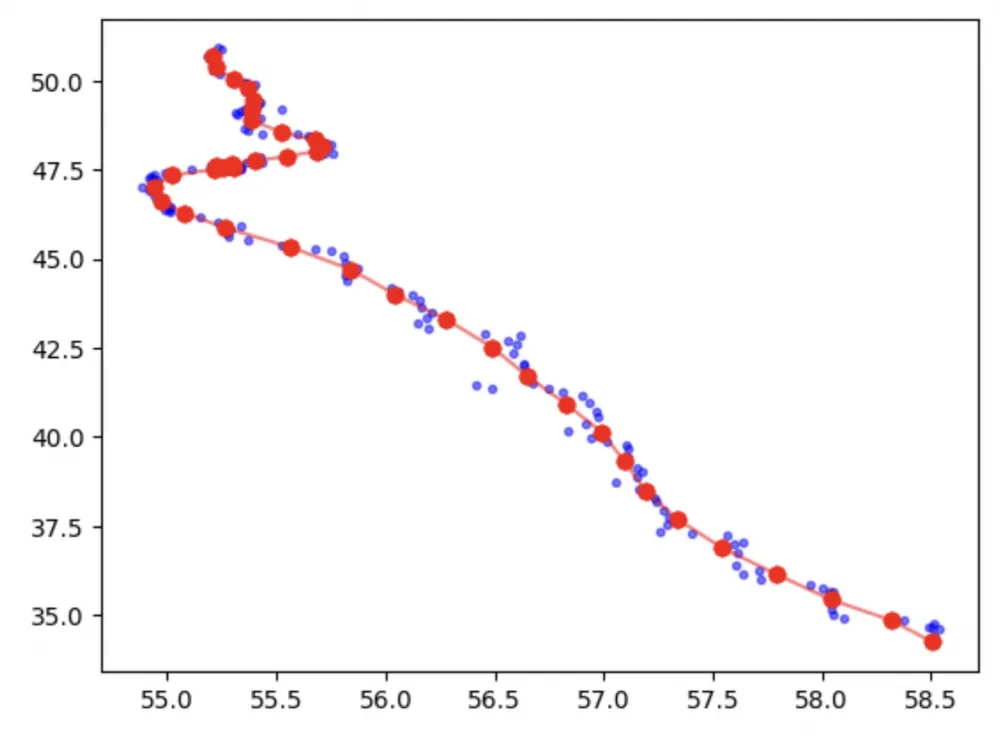
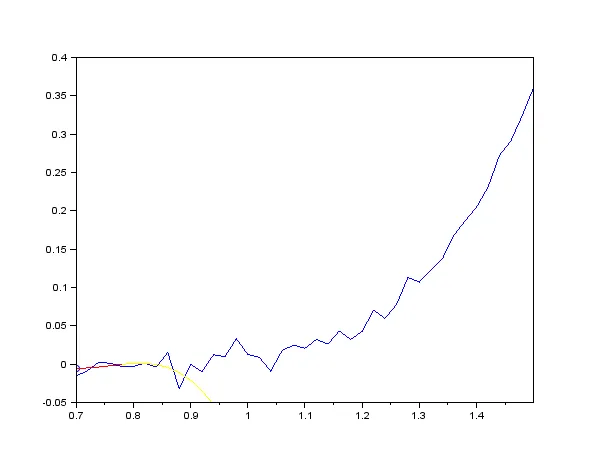
Fig. 2: The lower figure shows the process of calculating the smoothing polynomial for each point of the input data sequence. The points of the output sequence are shown as circles (wiki). The upper figure shows an example of applying the Savitzky–Golay filter to the raw coordinates of a player on a football field in one of the episodes. The axes represent the player’s coordinates; blue dots denote the original, unprocessed values (defined by bbox), and red dots represent the intermediate results after filtering and noise suppression by the system. It is clearly visible that the filter effectively eliminates noise, making the trajectory smoother, while the real sharp maneuvers of the player remain noticeable.
We tested various methods to combat noise, and the most successful results were achieved using the Savitzky–Golay filter. This method, which came into time series analysis from the world of spectroscopy and chemistry, is excellent at preserving the envelope of complex trajectories, carefully "cleaning" minor noise without distorting angles and sharp transitions.
By working with such smoothed data, we can calculate instantaneous speeds more accurately, which, in essence, are the derivative of the player’s position over time. Speed is the central, basic metric around which almost all other fitness indicators are built. For example, an important characteristic such as the distance traveled is calculated by integrating the speed function, i.e., its area under the graph over time. If the speed is defined with an error, the final distance will also be inaccurate. Therefore, the quality of calculating instantaneous speeds directly determines the accuracy of all subsequent analytical conclusions.
Error Estimation
The fitness metrics calculation system based on video broadcasts is a full-fledged measuring instrument with inherent errors and limitations that are important to consider for proper analysis. For objective evaluation of such systems, there are international standards and special test exercises, such as FIFA tests, where the player movements are known, and the system must accurately capture them.
Successfully passing FIFA tests is not just a mark of quality: it is official accreditation confirming the suitability of the collected data for professional sports and scientific research. Such certification guarantees that the analytics meet global standards.
The question arises: how can the tracker be calibrated without information about the actual trajectory of the player's movement, as even video and visual observation do not provide full accuracy in evaluating the participants' speeds?
In sports analytics practice, benchmark data is typically obtained from equipment that has already undergone strict certification and official accreditation, i.e., a system that the global professional community truly trusts. This could be, for example, a positioning system approved by FIFA or other sports federations.
In our project, we are very fortunate: the football club "Krasnodar" has opened its doors for collaboration. At their modern home stadium, one of the advanced movement tracking systems based on LPS (Local Positioning System) technology called Catapult is deployed. Currently, there are several technological approaches to the task of determining athlete movements: GPS (Global Positioning System), LPS (local high-precision radio networks), and optical systems (Optics), such as Vicon.
The LPS used in our test is rightfully considered a modern standard for measuring physical indicators and athlete positioning. Its main advantages are high accuracy, resistance to external interference, and a high data collection frequency. For example, Catapult operates at a frequency of 10 Hz. Unlike GPS, which is often unstable in closed or confined spaces, LPS provides reliable and objective data inside the stadium. This ensures the most accurate determination of the players' movement speed and the distance traveled in arenas where the receiver and sensor network is deployed.
Modern LPS systems, such as Catapult, are recognized as the global standard and can be used to validate new tracking solutions.
Our system can operate both online, analyzing matches in real time, and offline. In the latter case, data is collected at the stadium, and processing and analysis are performed after the recording is completed. The system uses the optical method, so the working frequency is determined by the number of frames per second in the video stream and typically amounts to 25 Hz. This provides high data detail. The testing described in the article was conducted in offline mode since it was not a match but a series of exercises. This allowed us to focus in detail on statistical data processing and careful error evaluation. At the same time, the online mode ensures the same high accuracy and uses the same technological algorithms for data collection and processing.
It is important to note that the entire data processing process in our project is fully automated: no manual edits or corrections are made. This guarantees the objectivity of the obtained metrics and maximum reproducibility of results.
In the process of error evaluation, we pay the most attention to key indicators such as maximum speed and distances traveled — as they determine most of the analytical and training conclusions.
To conduct the most reliable testing, we invited four professional football players to the stadium, each of whom performed a series of special exercises. The tasks simulated various movement patterns: from sprints and sharp turns to complex trajectories in confined spaces, closely resembling real-game situations.
To build the evaluation on the confidence interval and visualize the distributions of the obtained data, we applied the bootstrap method. This allows us to repeatedly and randomly reuse the original measurements, forming an ensemble of error estimates, thus providing a confidence interval estimate for our key metrics.
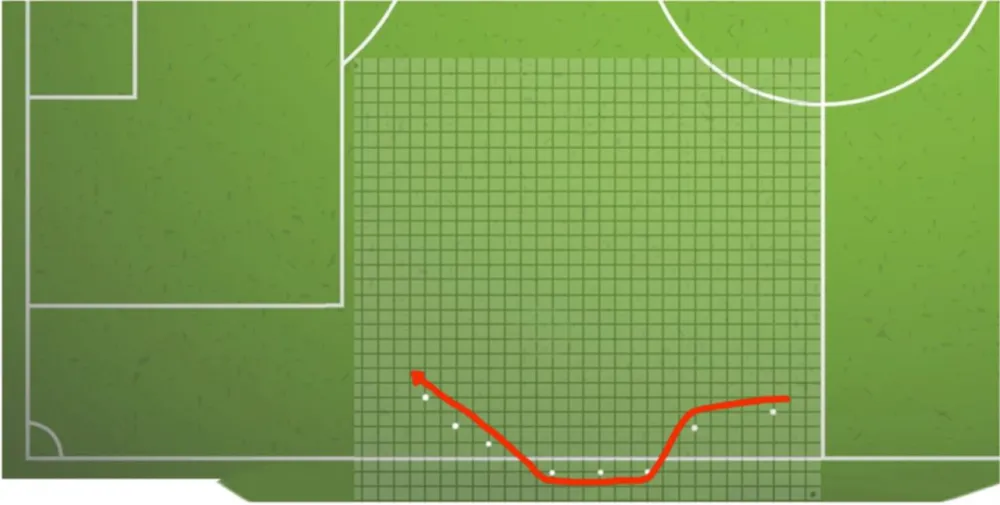
Exercise "Zmeyka"
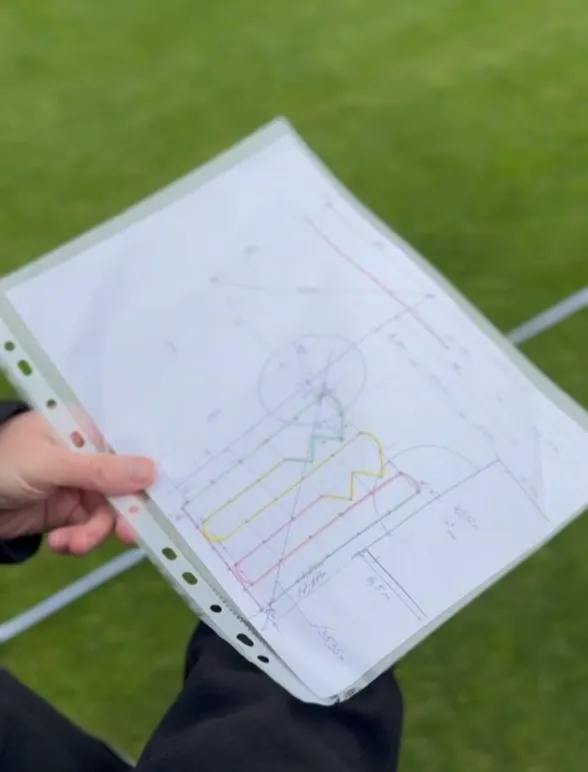
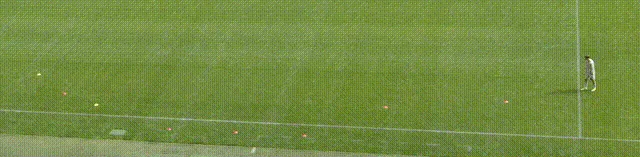
Four subjects took turns completing a route with frequent changes in direction and speed, requiring precision and agility: a combination of sharp turns and accelerations created a variety of conditions to test the positioning system. The main goal was to check how accurately the system tracks the athlete's position in different movement modes, revealing the strengths and weaknesses of tracking in both smooth and extreme situations.
The "Snake" course marking represented a complex trajectory on a 25×25 m field, with the most painstaking part of preparation being setting out the markers. The distance was 220 meters, with completion times ranging from 46 to 62 seconds depending on participant level. The route with numerous turns simulated real game situations, and maximum speed was only reached on the final straight section.
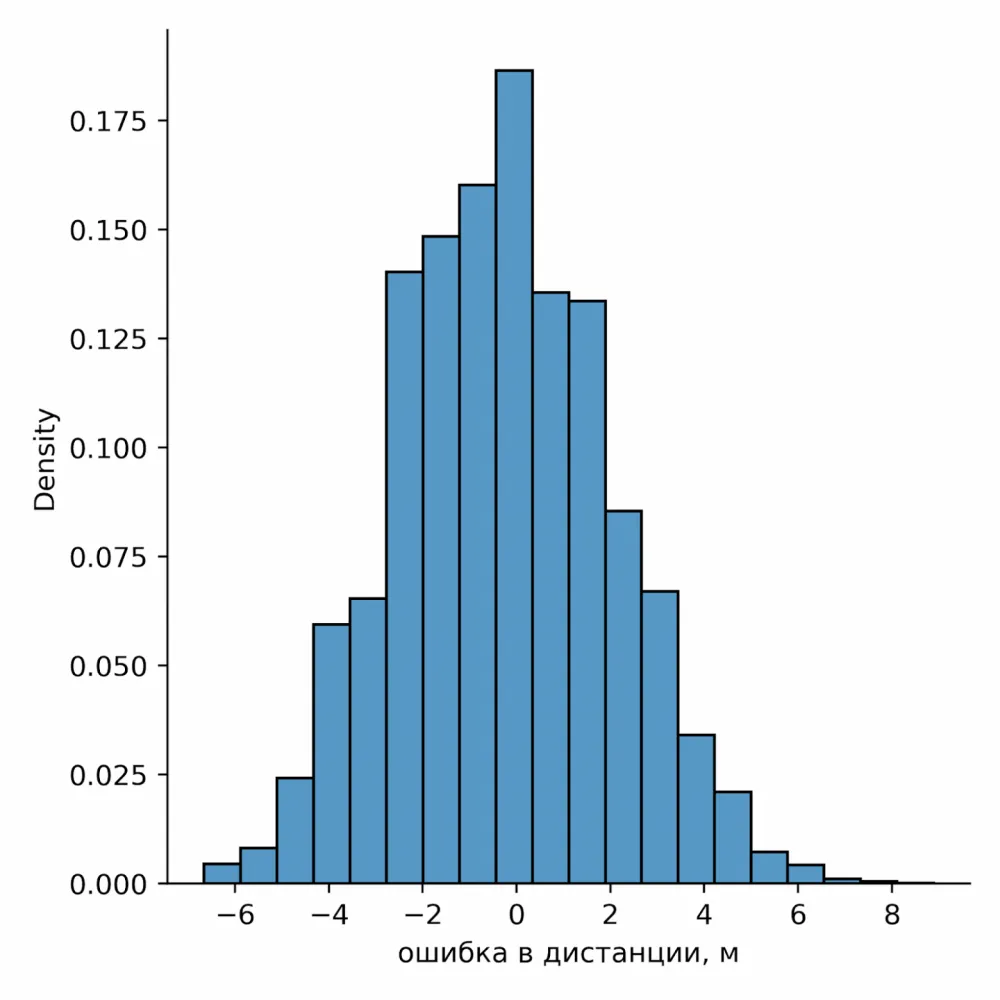
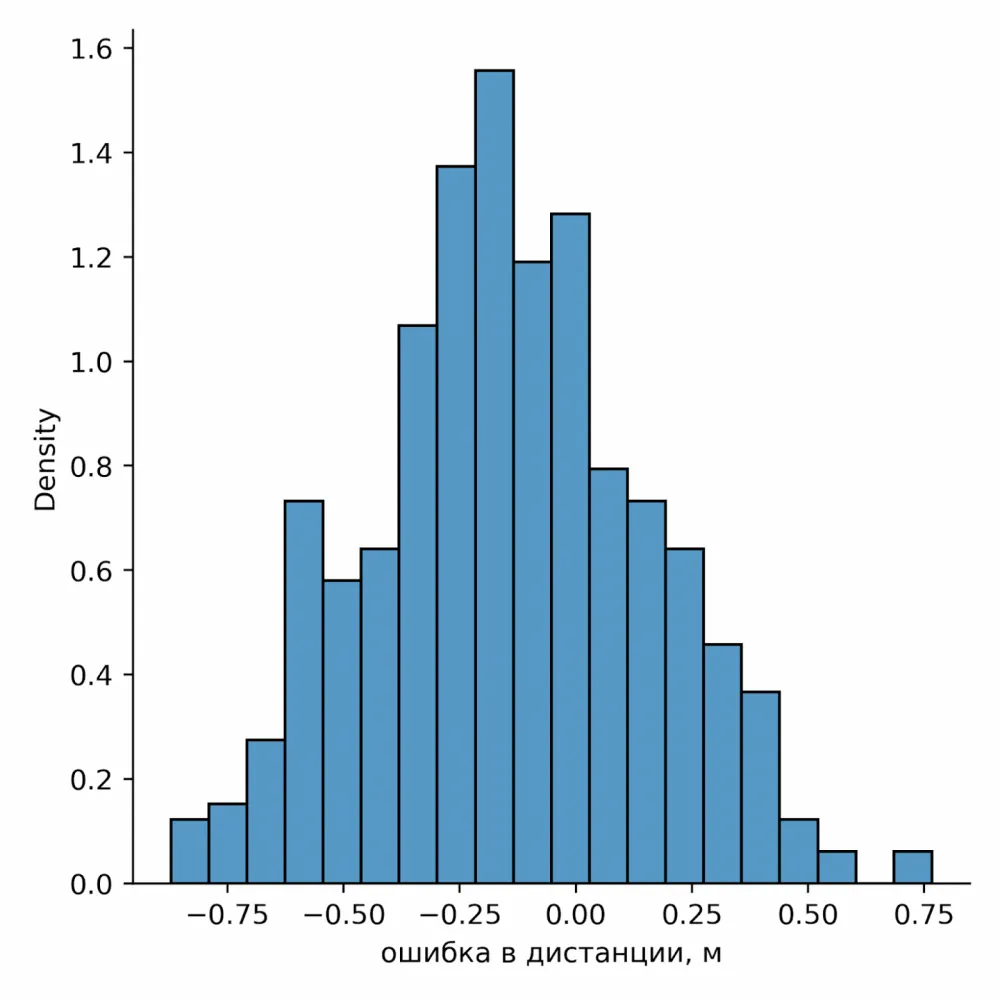
The distribution of the system-measured distance error turned out to be close to normal. This means there’s no systematic bias in either direction. The mean error value for total distance was almost zero (–0.25 m), which indicates no significant trend toward overestimating or underestimating results: overall, the system "does not err" to either side. Detailed quality metrics for total distance across all exercises are given in Table 1.
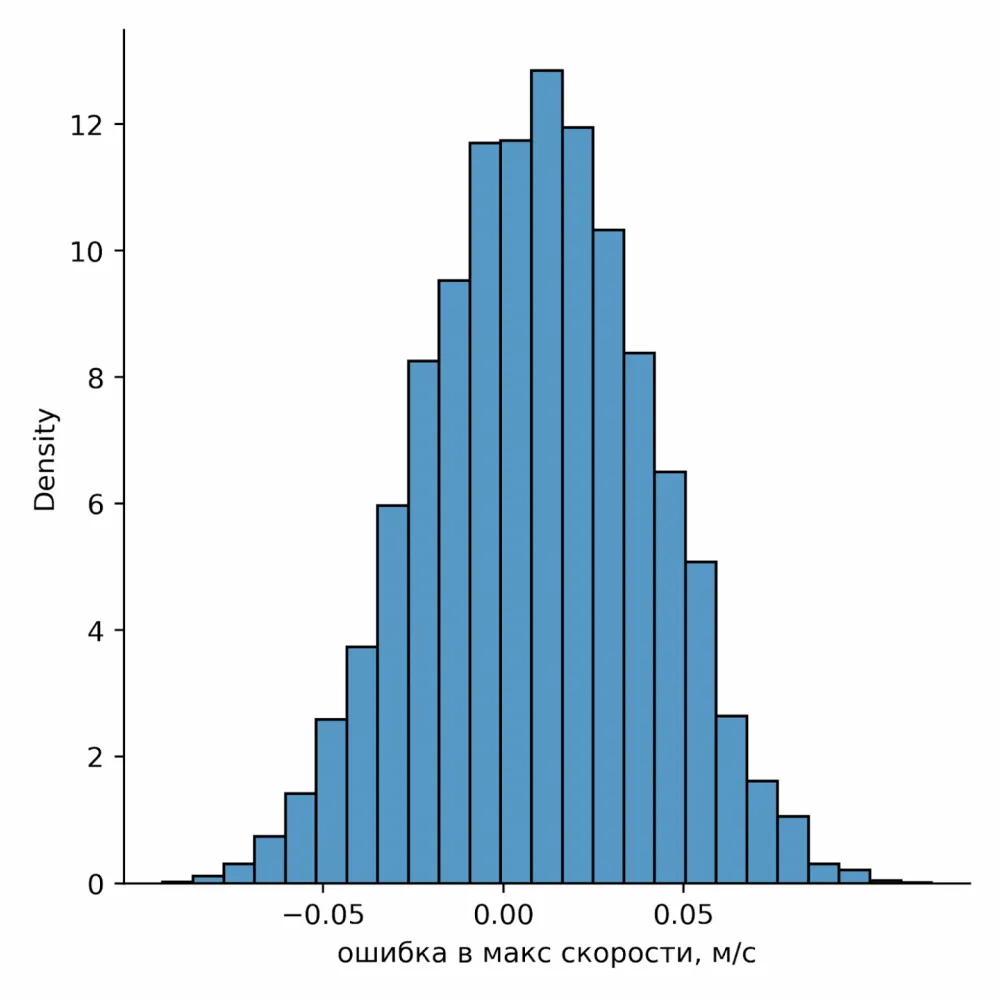
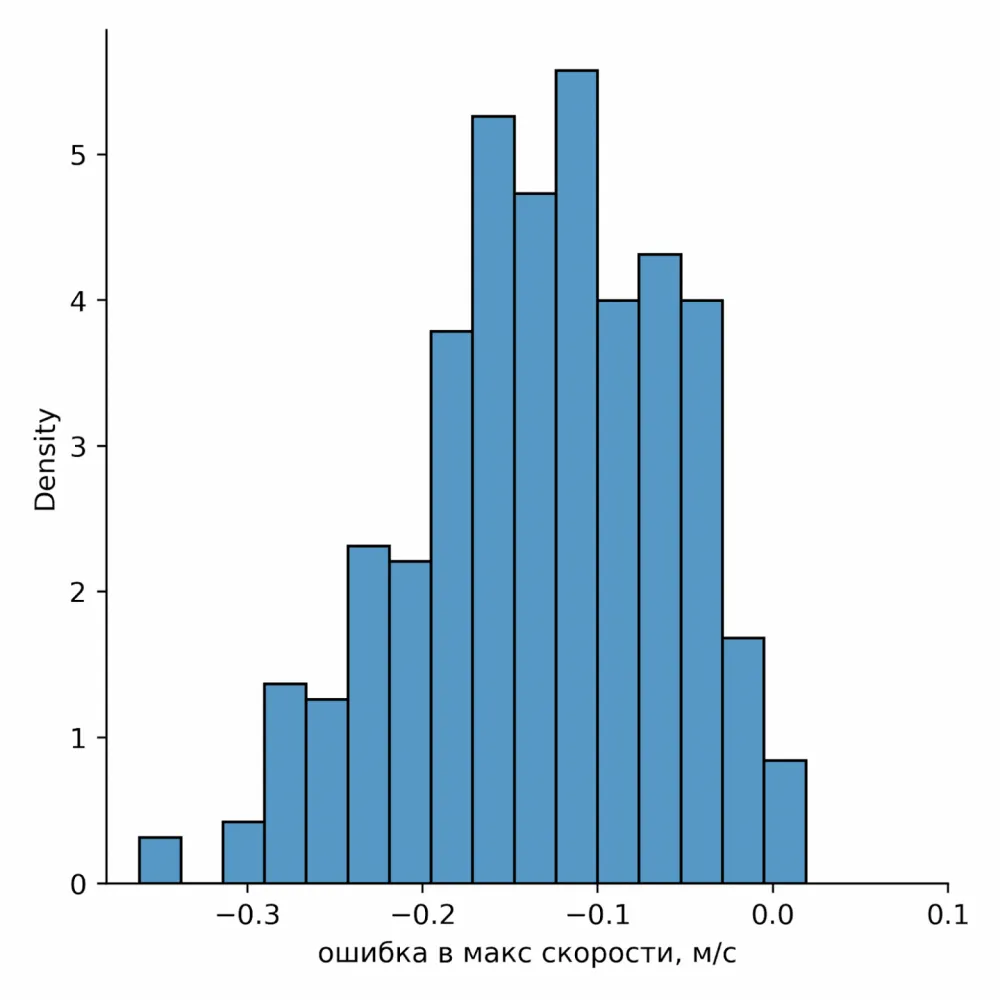
The distribution of error in determining maximum speed is also close to normal. The average error value for maximum speed is practically zero (0.02 m/s). The respective quality metrics for maximum speed across all exercises are presented in Table 2.
"Out of Bounds" Exercise
In this test, each participant completes the route three times with increasing dynamics: first walking, then running, and finally at maximum speed. Part of the trajectory (more than 6 meters) passes outside the marking, after which the participant returns to the field, simulating real in-game situations of unexpected exits and returns.
The goal of the exercise is to determine whether the tracking system can reliably record movements when a player temporarily leaves the controlled area, which is valuable for accurate match analysis. Errors in measuring the total distance will immediately show how completely the system registers movement even when leaving the field, by comparing the actual and registered distance.
The systematic error in determining maximum speed was at the level of 0.12 m/s — such a small difference allows even the fastest athlete accelerations in the dynamics of the game to be reliably recorded.
Detailed quality metrics for total distance and maximum speed in this exercise can be found in Tables 1 and 2.
Exercise "Sprints"

In this experiment, athletes performed a series of 40-meter sprints, starting outside the test area and finishing in a marked 30×30 meter zone. The aim was to confirm that the positioning system accurately tracks the path inside the zone even at maximum speeds typical for real-game episodes.
Quality metrics for maximum speed and total distance in this exercise can be found in Tables 1 and 2.
This exercise made it possible to evaluate the system's performance under truly extreme speeds, with athletes accelerating to 7 m/s and above. Metrics for distances covered at speeds above 7 m/s are especially noteworthy. In this range, the system showed high accuracy: the RMSE for such segments was 0.99 m, MAPE - 4.8%. The majority of measurements fell within a deviation of less than one meter (see Table 3 and the figure below). A slight bias was detected (mean error –0.47 m), indicating a tendency to slightly underestimate the distance. We have noted this as a point for further improvement of the system. Overall, even at extreme speeds, the system demonstrated reliability and accuracy.
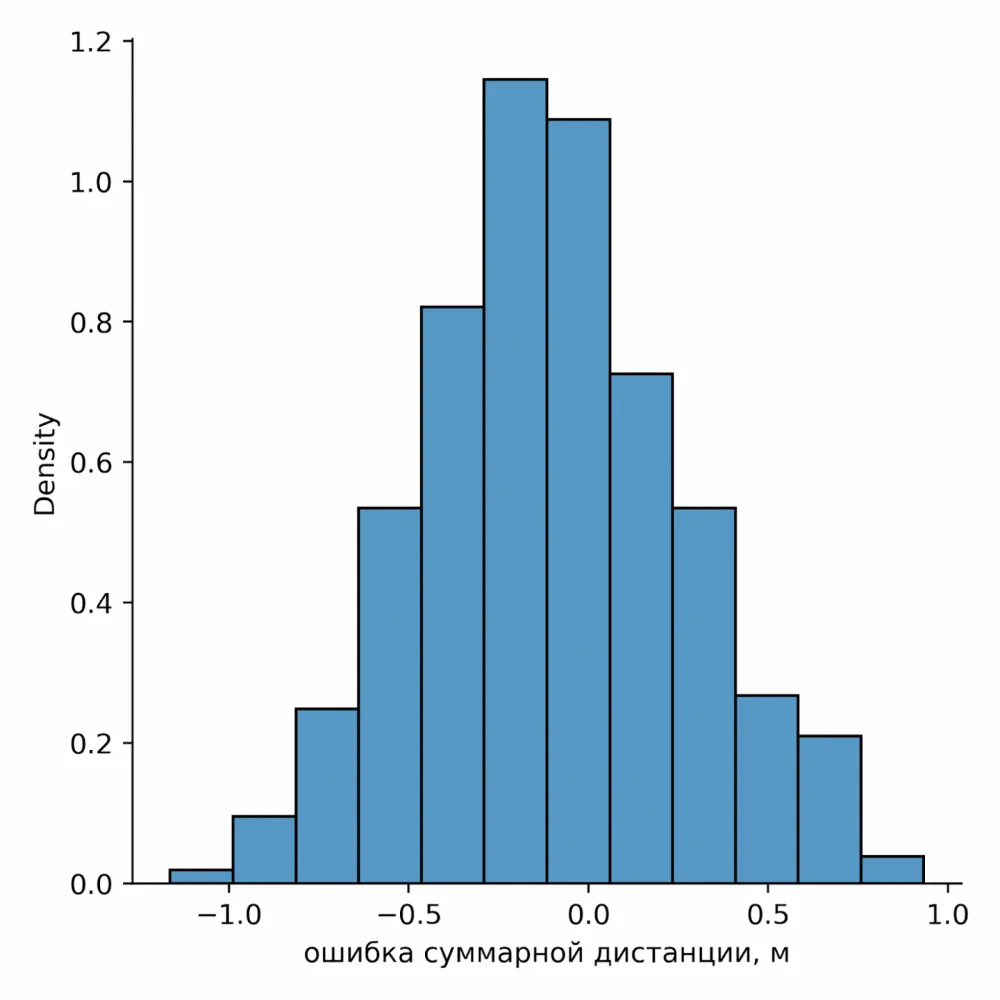
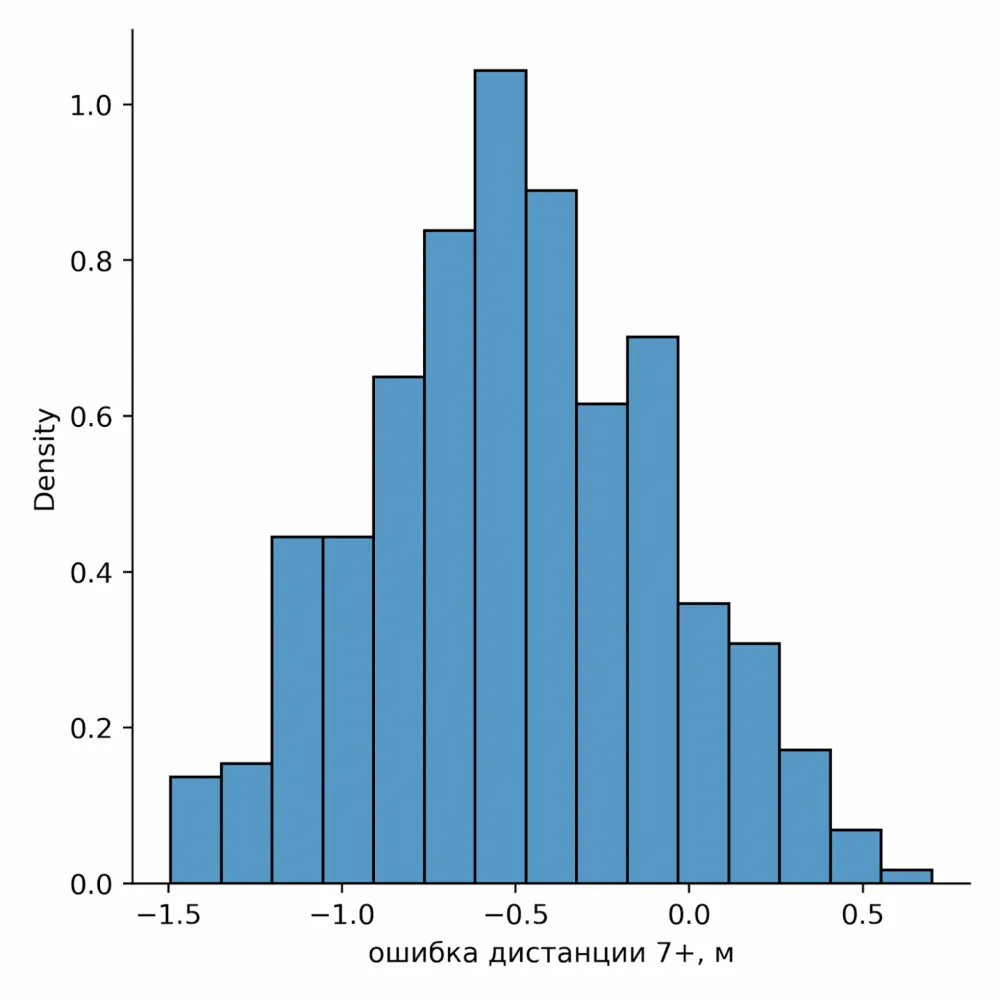
Figure: distribution of error in distance measurement and error in distance measurement at speeds above 7 m/s
Quality metrics
To assess the quality of the tested system, we used metrics such as RMSE and MAPE. Their values allow for a quantitative assessment of the algorithm's accuracy: RMSE (root mean square error) shows how much, on average, the measurements deviate from the actual values, while MAPE (mean absolute percentage error) expresses this deviation as a percentage, which is convenient for understanding the scale of the error. The assessment of the 95% confidence interval additionally provides an idea of the range in which the majority of errors are most likely to fall, i.e., allows for the evaluation of the system's reliability and stability.
Tables 1 and 2 show the system's error estimates for total distances and maximum speeds achieved during the exercises. Table 3 presents error metrics for movement segments where the athlete's speed exceeded 7 m/s. With a near-zero mean error and a normal symmetric distribution, as in our study, the RMSE values and the boundary of the 95% confidence interval are similar, since both indicators characterize the scale of statistical error dispersion. Significant differences between them mainly appear in cases of bias, skewness, or extreme outliers, which are not observed in this case.
Distances | Out of bounds | Sprints | Slalom |
RMSE | 0.59 m | 0.71 m | 3.34 m |
MAPE | 1.3% | 0.97% | 1.25% |
Conf. interval | 0.64 m | 0.9 m | 3.7 m |
Table 1: estimation of distance measurement error
Max speeds | Out of bounds | Sprints | Slalom |
RMSE | 0.19 m/s | 0.04 m/s | 0.06 m/s |
MAPE | 3.1% | 0.46% | 0.73% |
Conf. interval | 0.17 m/s | 0.03 m/s | 0.07 m/s |
Table 2: estimation of maximum speed measurement error
RMSE | MAPE | Conf. interval (95%) | |
Distance 7+ | 0.99 m | 4.8% | 0.92 m |
Table 3: estimation of error for distances at speeds above 7 m/s
Interim conclusions
During the tests, we were able to assess the accuracy of distance measurement under different speed modes and along different trajectories, including challenging game conditions for tracking.
The analysis shows: the longer the movement trajectory, the more noticeable the relative error in distance measurement. This is a natural result, given the cumulative errors in positioning. Nevertheless, in all tests, the maximum error did not exceed 4.8% of the total distance, which can be considered a very good result. According to official FIFA testing protocols (such as the EPTS FIFA Quality Programme Test Protocol), football tracking systems must ensure an average deviation of no more than 5% for distance run in order to receive the FIFA QUALITY certificate. Thus, our results fully comply with international quality standards.
In this article, we'll focus on "Sprints," and in a few days we’ll tell you about the "2x2" game and synthetic tests, take a closer look at quality assessment under the FIFA protocol, and share our conclusions. And yes, we've also collected some interesting facts and a few unexpected pitfalls worth discussing.
If you have any questions about the article or about football match analytics in general—write in the comments, we’ll try to answer.
We sincerely thank FC Krasnodar for the opportunity to test and calibrate our system at one of the country’s best stadiums, relying on the “gold standard” of fitness metrics. This collaboration not only increases the accuracy and reliability of our measurements, but also contributes to the integration of state-of-the-art technologies in Russian and global sports analysis.


Write comment