
- Network
- A
Detection is easy. Installing Elastiflow for network threat detection
We will start a series of articles called Detection is easy, dedicated to Detection engineering, which I write about in the Telegram channel of the same name.
Introduction
One of the stages of DE is determining the sources of events and organizing their collection. In this article, we will look at the installation of Elastiflow — a powerful solution for processing and visualizing network data, built on the ELK stack (Elasticsearch, Logstash, Kibana). Elastiflow provides the ability to collect, process, and analyze data from various network protocols, such as NetFlow, sFlow, and IPFIX. The main advantage of Elastiflow over the classic ELK stack is the optimized network telemetry collection agent, as well as the availability of ready-made dashboards and visualizations that simplify network traffic analysis.Initially, the project was developed on GitHub, but the developers switched to a commercial solution — flow-collector, which demonstrates significantly higher performance compared to the version available on GitHub. More detailed information about the differences can be found in the documentation. The licensing policy allows you to use the product for free, but if you register, about 480 fields and the use of one instance (4000 records per second, 500 without registration) will be available.
Operating System Preparation
To minimize the likelihood of data loss during traffic spikes, you should change the Linux kernel network parameters as suggested in the documentation. You can create a file in the /etc/sysctl.d/ directory so that they are applied automatically when the system boots. If you have less than 75,000 flows per second:
net.core.netdev_max_backlog=4096
net.core.rmem_default=262144
net.core.rmem_max=67108864
net.ipv4.udp_rmem_min=131072
net.ipv4.udp_mem=2097152 4194304 8388608
if more than 75,000 flows per second:
net.core.netdev_max_backlog=8192
net.core.rmem_default=262144
net.core.rmem_max=134217728
net.ipv4.udp_rmem_min=131072
net.ipv4.udp_mem=4194304 8388608 16777216
Let's recall what the above kernel parameters are responsible for, more details about tuning the network part of the Linux kernel can be read here (kermel, 0, 1,2 , 3, 4, 5):
net.core.netdev_max_backlog - the maximum number of packets that can be queued for processing in the network interface.
net.core.rmem_default - the default buffer size for receiving.
net.core.rmem_max - the maximum buffer size that can be set by an application for receiving.
net.ipv4.udp_rmem_min - this parameter sets the minimum buffer size for receiving UDP.
net.ipv4.udp_mem - this parameter sets three values that define the memory consumption thresholds for the UDP protocol.
Installing and configuring flow-collector
To run flow-collector on Debian/Ubuntu, execute the following commands:
# Install the necessary libraries
apt install libpcap-dev ca-certificates

# Download the deb package
wget https://elastiflow-releases.s3.us-east-2.amazonaws.com/flow-collector/flow-collector_7.5.3_linux_amd64.deb

# Install the package
dpkg -i flow-collector_7.5.3_linux_amd64.deb
Configuration files are located in /etc/elastiflow. Before starting, we need to edit the flowcoll.yml file.
The developer's website provides a docker-compose for running flow-collector in a container.
As already mentioned, the Elastiflow configuration file is located in the /etc/elastiflow directory. To get started, you need to change the value of the EF_LICENSE_ACCEPTED parameter to "true". Unlike its predecessor, flow-collector supports standard output to systems such as Kafka, Elasticsearch, OpenSearch, Grafana, Splunk, and others.
To send data to Elasticsearch, you need to uncomment the lines that start with EF_OUTPUT_ELASTICSEARCH_* and set the value to true for EF_OUTPUT_ELASTICSEARCH_ENABLE.
The developers have provided a convenient docker-compose file for creating a test lab, as well as for more productive environments. This will allow you to quickly deploy the necessary infrastructure and start working with network data without any extra effort.
To test Elasticsearch and Kibana, use the following docker-compose:
yaml
version: '3'
services:
  kibana:
    image: docker.elastic.co/kibana/kibana:7.13.1
    container_name: kibana
    restart: unless-stopped
    network_mode: host
    depends_on:
      - elasticsearch

    environment:
      TELEMETRY_OPTIN: 'false'
      TELEMETRY_ENABLED: 'false'
      NEWSFEED_ENABLED: 'false'

      SERVER_HOST: '0.0.0.0'
      SERVER_PORT: 5601
      SERVER_MAXPAYLOADBYTES: 8388608

      ELASTICSEARCH_HOSTS: 'http://elasticsearch:9200'
      ELASTICSEARCH_REQUESTTIMEOUT: 132000
      ELASTICSEARCH_SHARDTIMEOUT: 120000

      KIBANA_AUTOCOMPLETETIMEOUT: 3000
      KIBANA_AUTOCOMPLETETERMINATEAFTER: 2500000

  elasticsearch:
    image: docker.elastic.co/elasticsearch/elasticsearch:7.13.1
    container_name: elasticsearch
    restart: unless-stopped
    ulimits:
      memlock:
        soft: -1
        hard: -1
      nofile:
        soft: 131072
        hard: 131072
      nproc: 8192
      fsize: -1
    network_mode: host
    volumes:
      - /var/lib/elasticsearch:/usr/share/elasticsearch/data
    environment:
      ES_JAVA_OPTS: '-Xms512M -Xmx512M'
      cluster.name: elastiflow
      node.name: first

      bootstrap.memory_lock: 'true'

      network.bind_host: 0.0.0.0
      http.port: 9200
      http.publish_port: 9200

      discovery.type: 'single-node'

      indices.query.bool.max_clause_count: 8192
      search.max_buckets: 250000

      action.destructive_requires_name: 'true'

      reindex.remote.whitelist: '*:*'
      reindex.ssl.verification_mode: 'none'

      xpack.monitoring.collection.enabled: 'true'
      xpack.monitoring.collection.interval: 30s
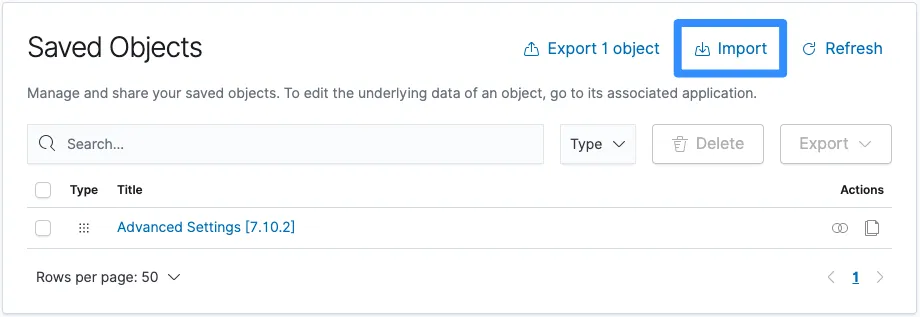
It remains to load the visualization objects into Kibana. They can be found in the product documentation. To import, go to Stack Management -> Saved Objects.
To emulate Netflow, I directed traffic from OPNsense and the utility nflow-generator.
nflow-generator generates NetFlow v5, with which we can check the correctness of our setup.
To run nflow-generator, we use a docker container:
docker run -it --rm networkstatic/nflow-generator -t -p --flow-count=1000 Conclusion
Preparing the above-described infrastructure does not take as much time as choosing and configuring network equipment to send traffic data. Using session metadata to detect attacks is not something new. Nowadays, expensive NTA/NDR solutions are widely used, but NetFlow and its analogs should not be discounted, they are good for the small weight of events and are sufficient to detect anomalies in the network. In the continuation of the series of articles, we will conduct a series of attacks and try to detect them using NetFlow data.


Write comment